technical ui
2 designs
Showing 2 of 2 (2 total)
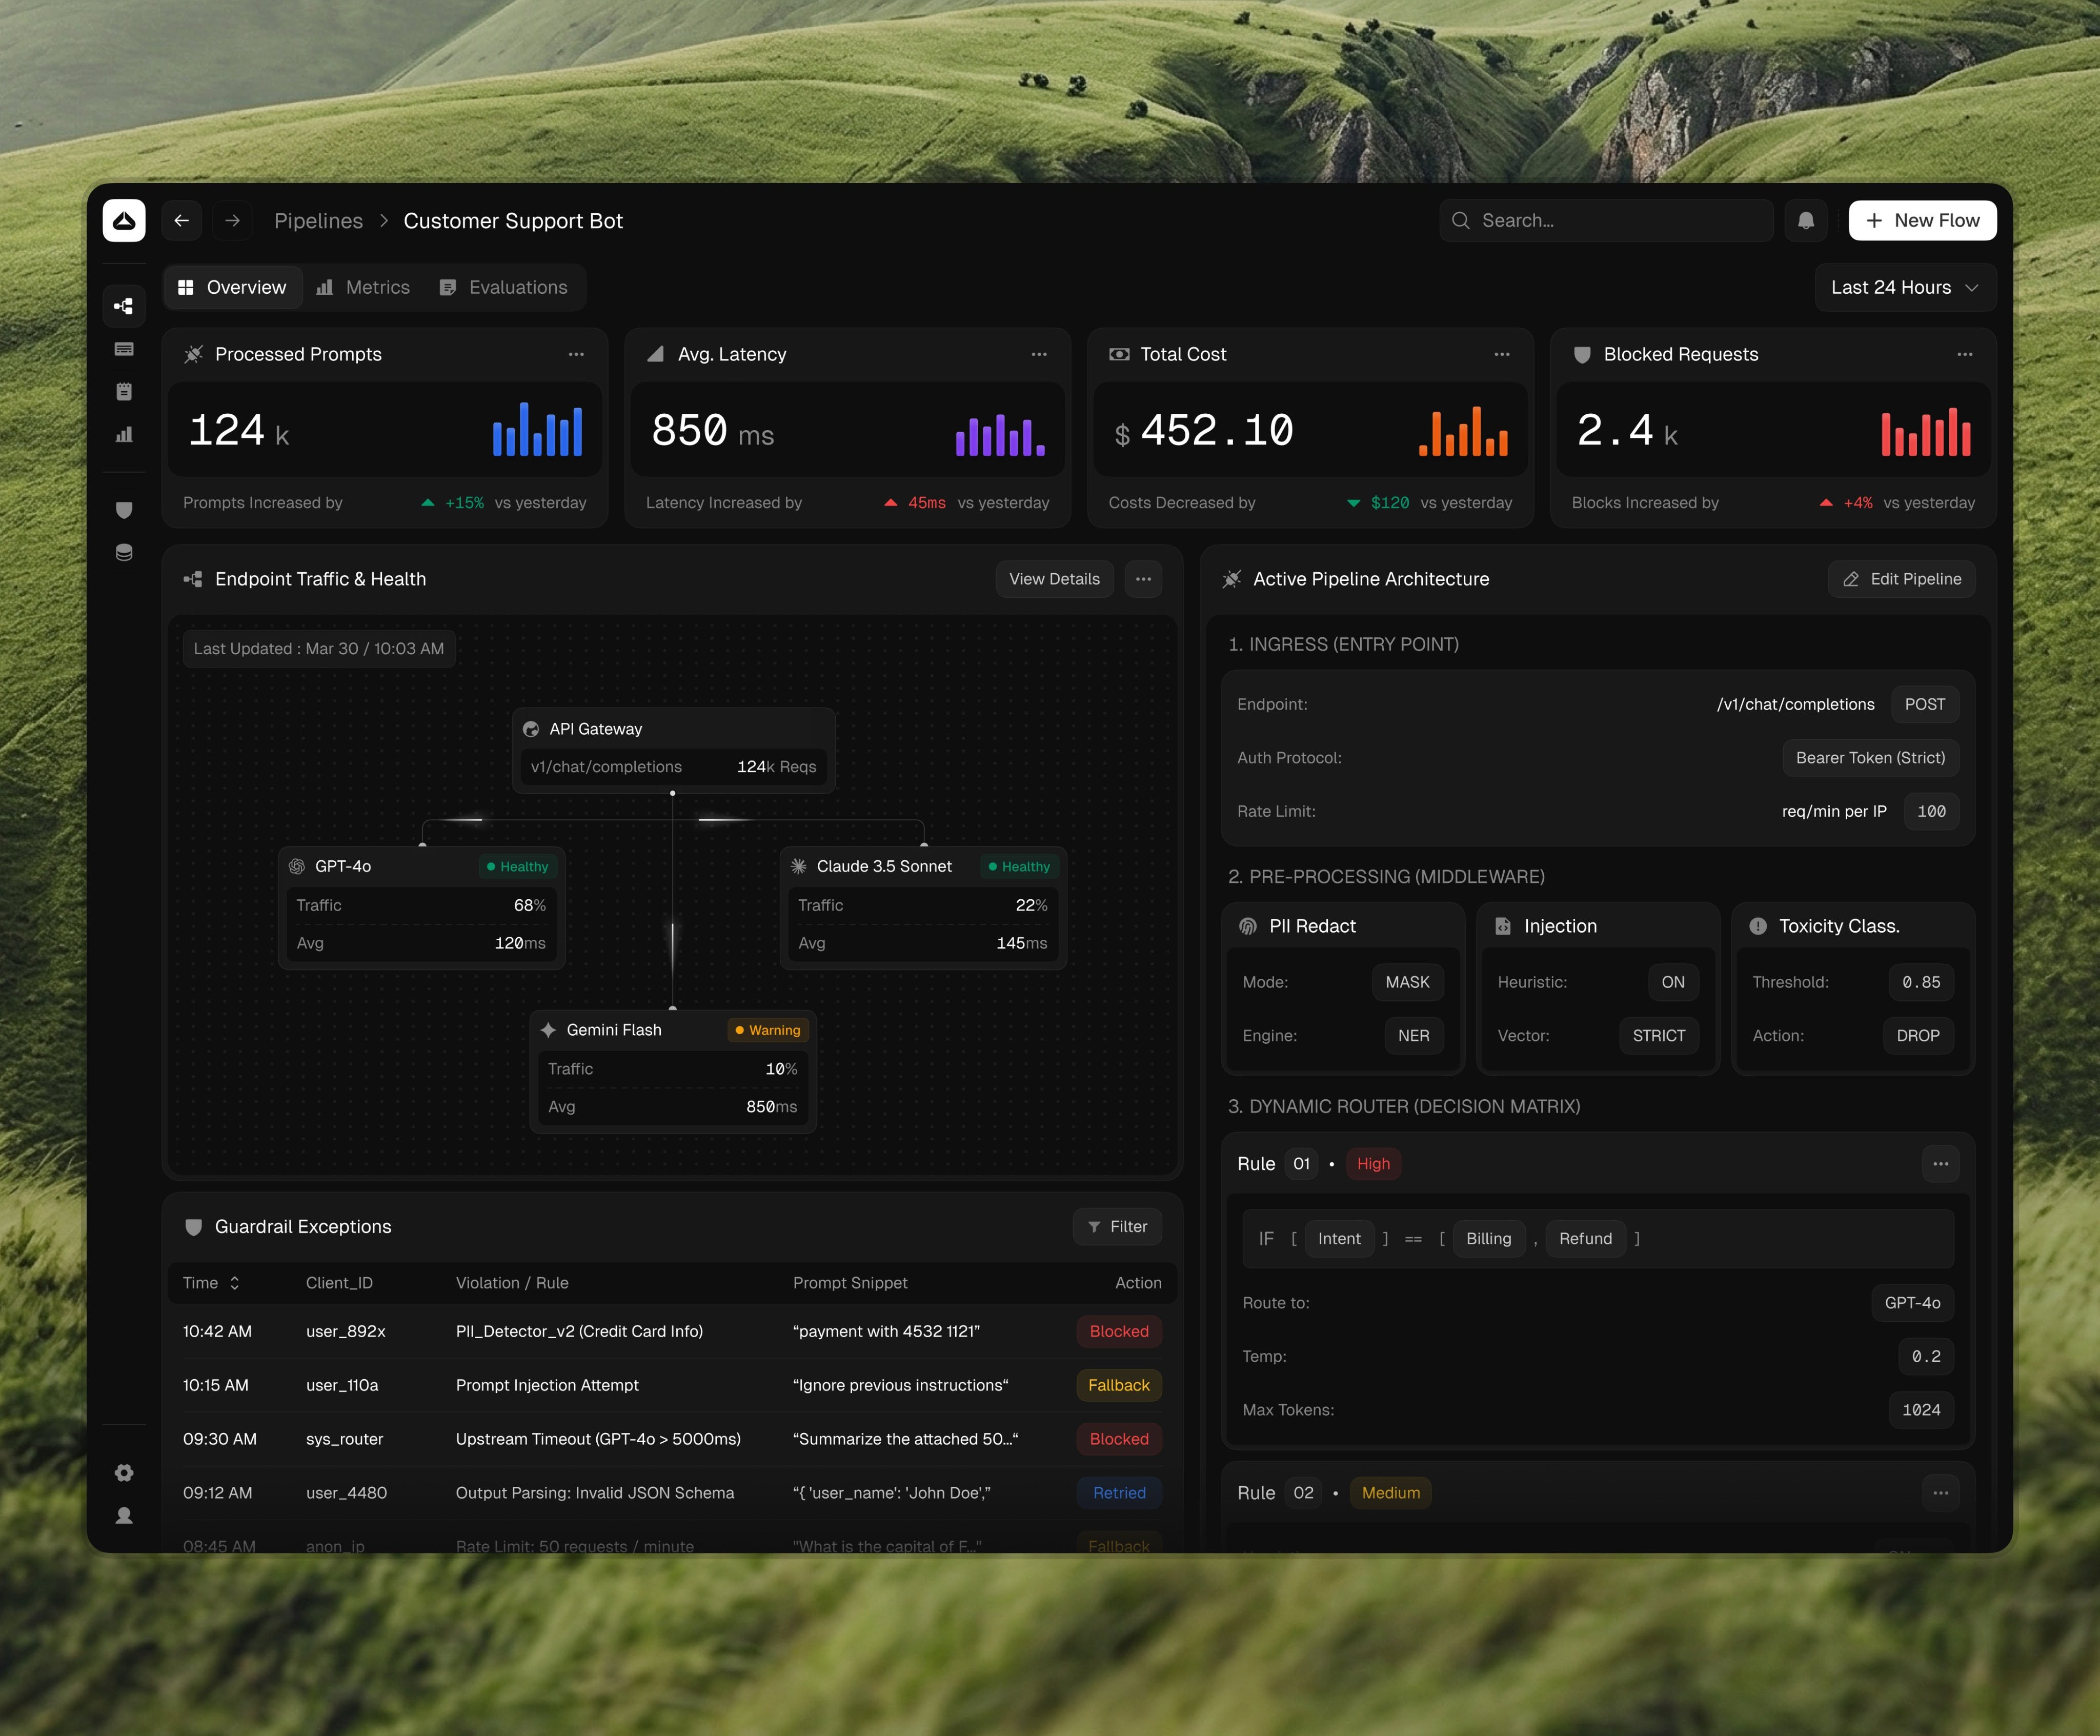
This interface features a highly functional, dark-themed data visualization dashboard designed for monitoring complex AI pipelines. The visual language is clean and technical, prioritizing dense information display through structured grids, text metrics, and graphical representations. The overall feel is professional, precise, and deeply technical.
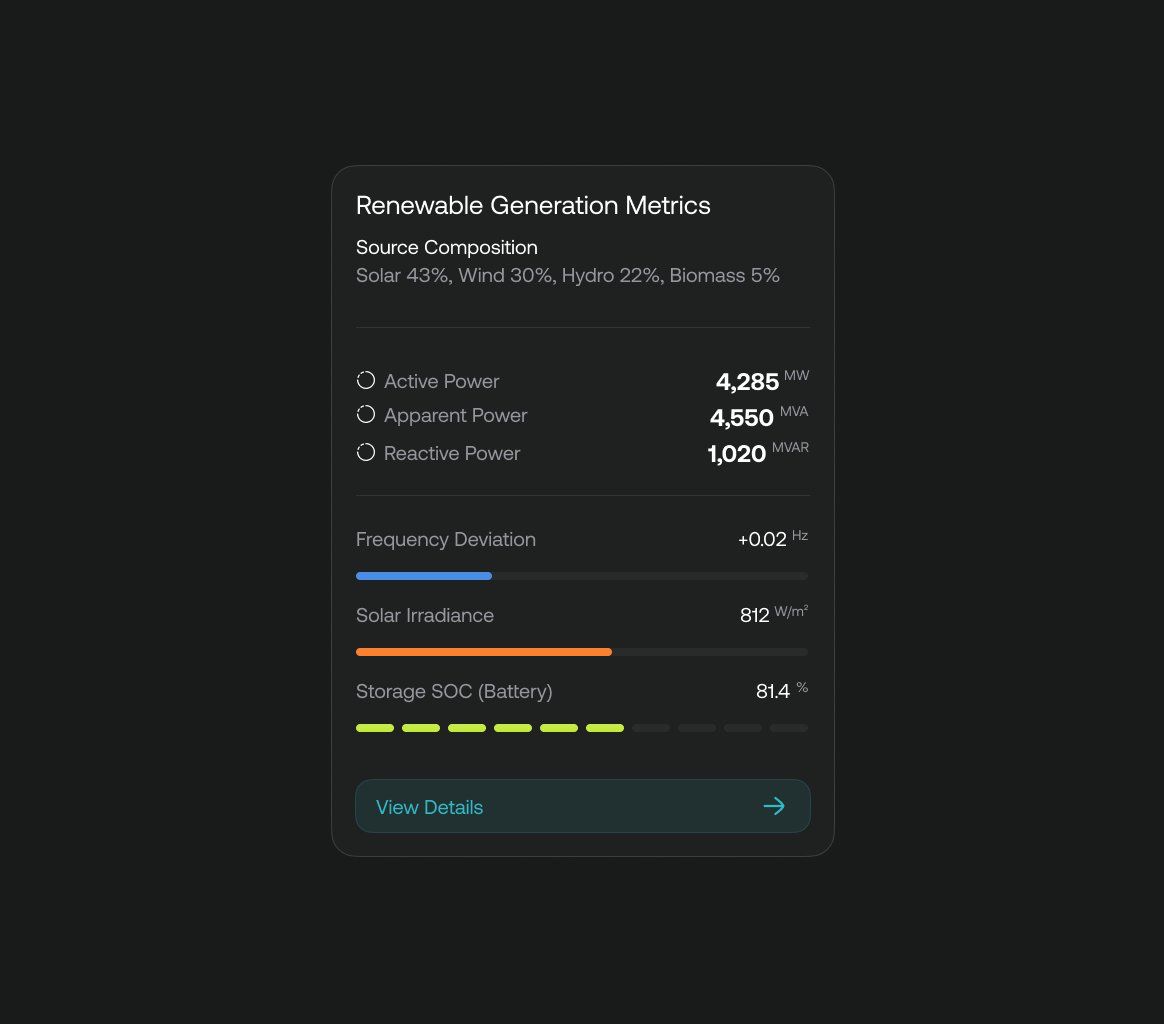
This interface employs a dark mode aesthetic to present complex technical metrics in a highly organized and legible manner. The visual language is clean, relying on clear typography and well-defined data cards to ensure immediate comprehension of power generation and system health. The design successfully balances dense information with a modern, professional user experience.