modular design
4 designs
Showing 4 of 4 (4 total)
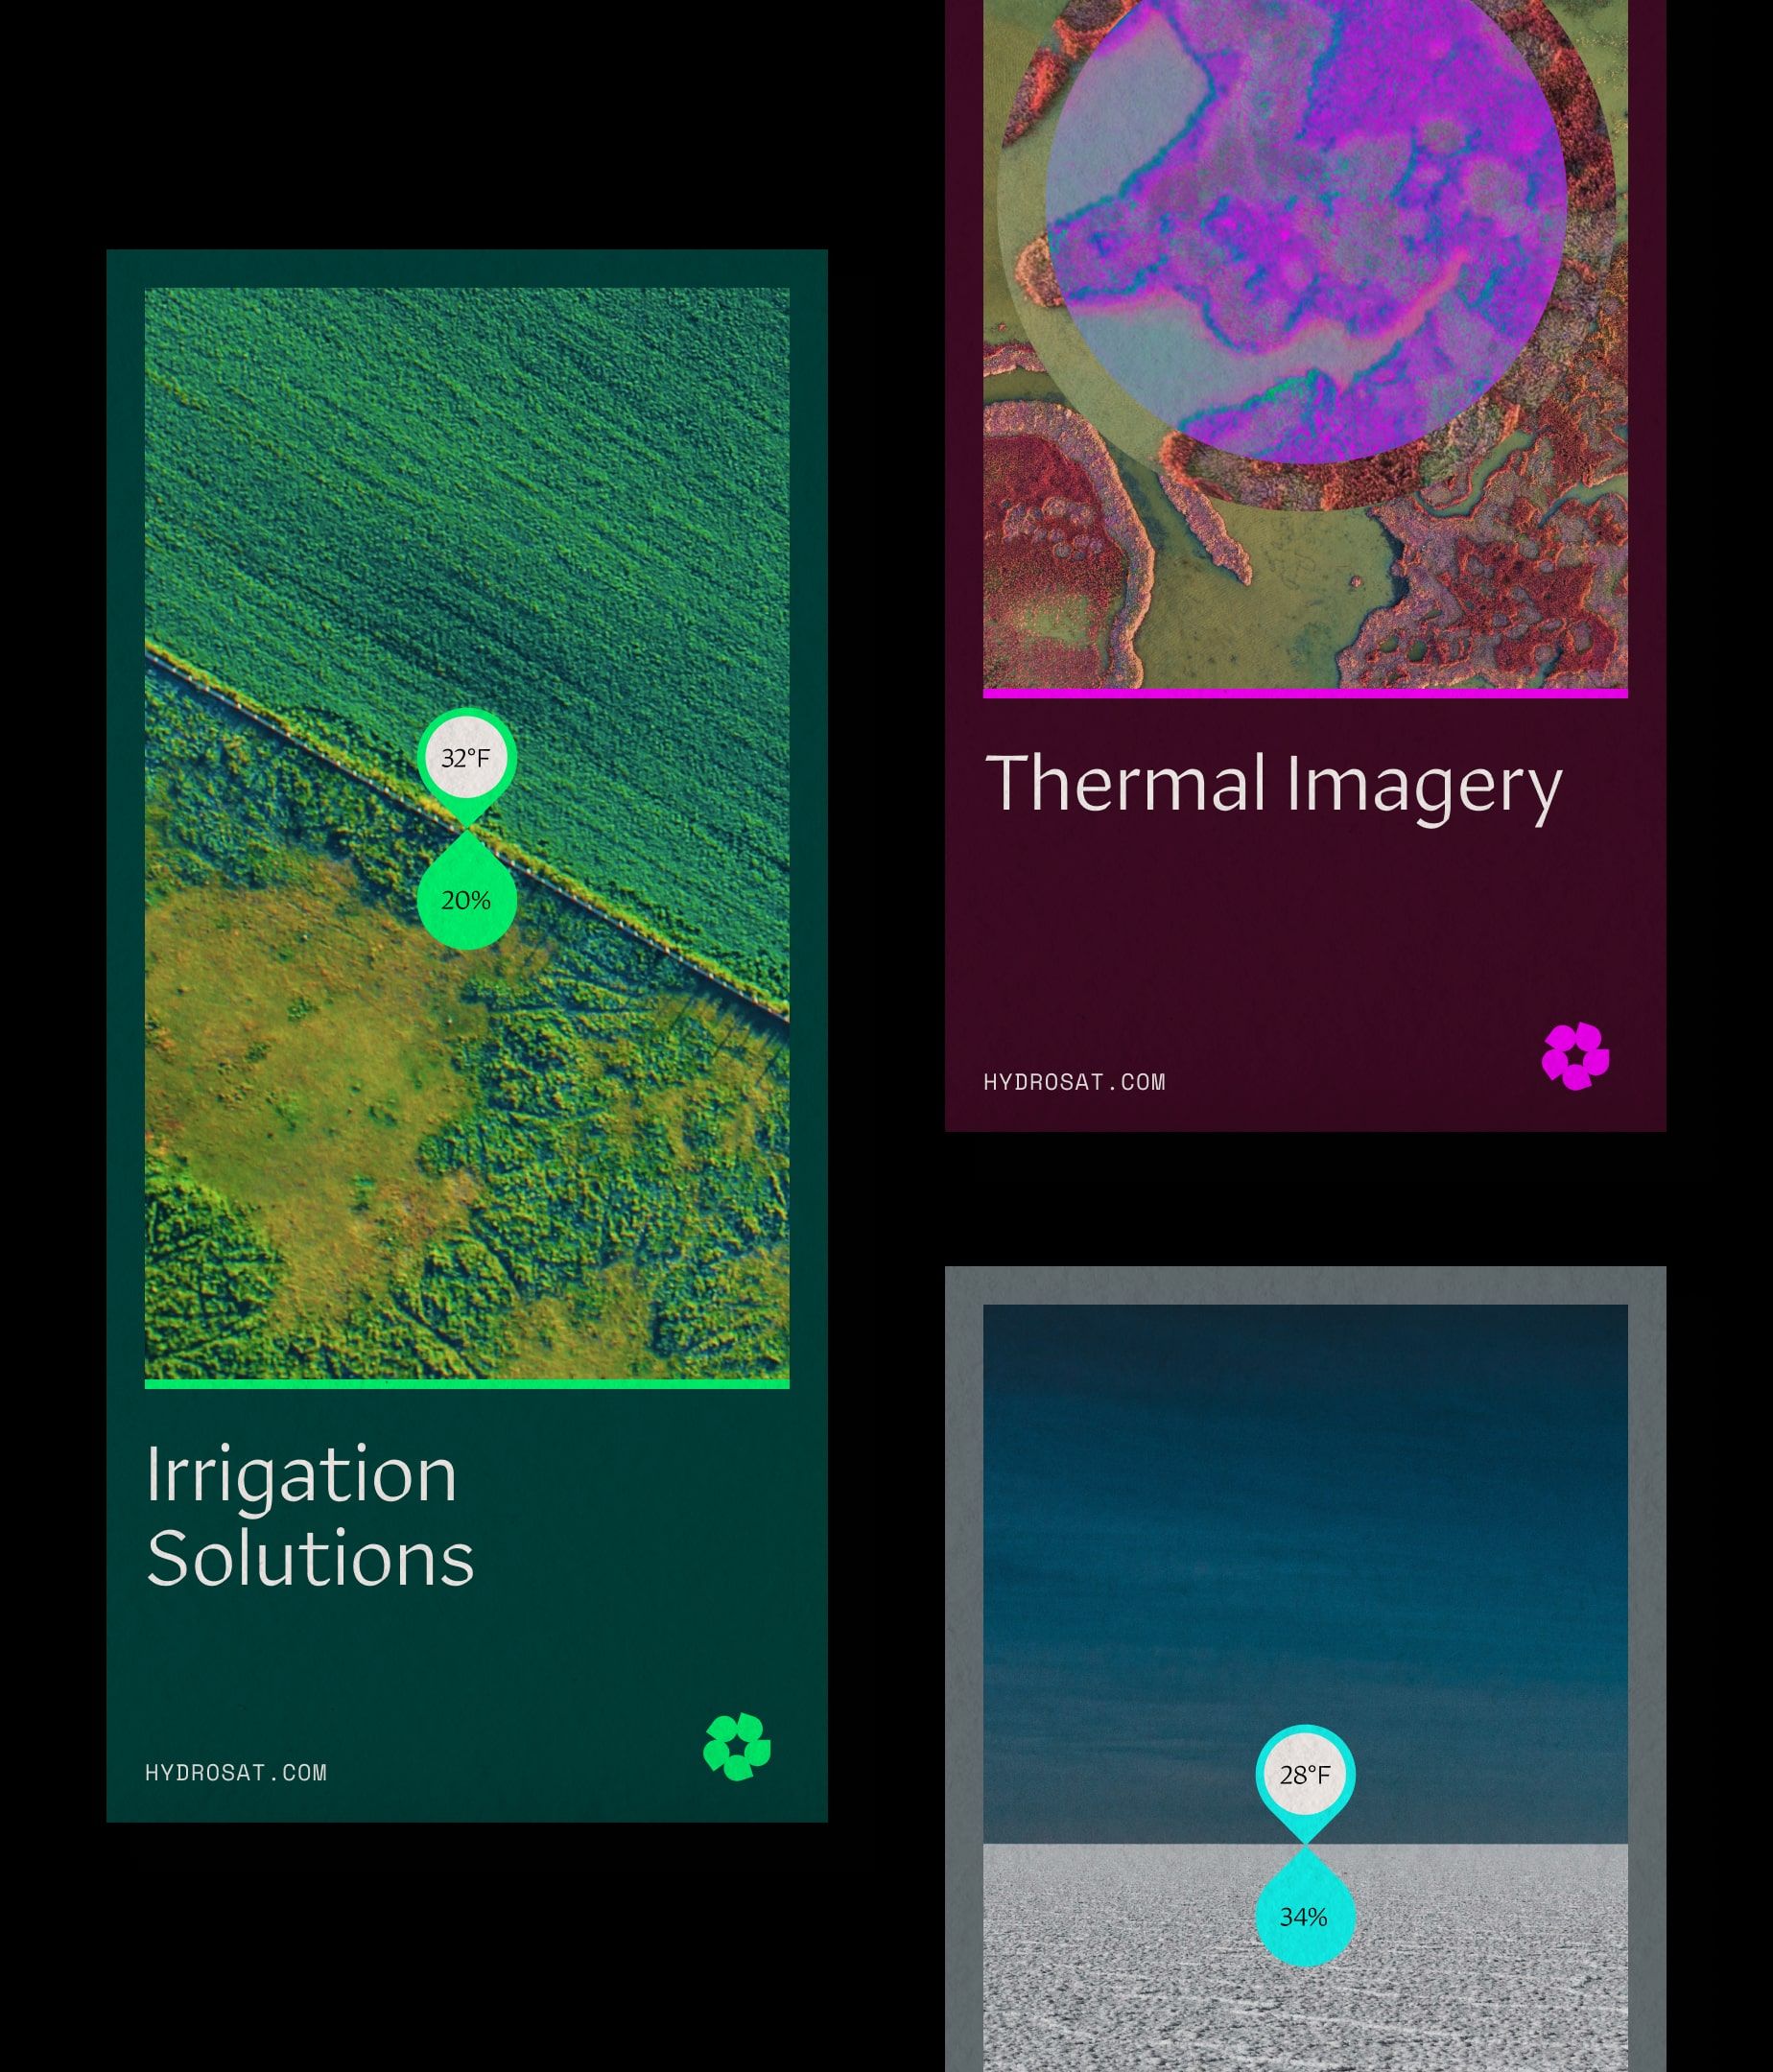
This is a modular, data-driven presentation showcasing environmental and thermal imagery. The design utilizes a dark background with vibrant, specific color accents to clearly separate different types of scientific data visualizations.
This is a dense, modular data infographic that utilizes bold typography and vibrant color blocking to present statistics and qualitative feedback. The design is clean and analytical, effectively breaking down complex information into digestible visual chunks suitable for corporate or HR reports.
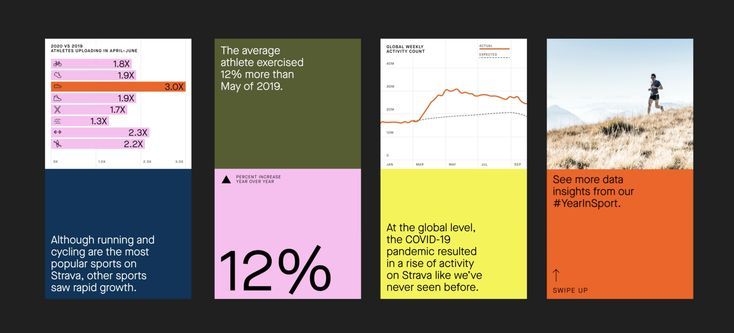
The design utilizes a clean, modular grid layout to present multiple data visualizations in an infographic style. It employs strong color blocking and contrasting accents (orange, green, blue) to clearly differentiate metrics and highlight key findings. The visual language is professional, analytical, and highly focused on conveying statistical information.

This design employs a modular collage style to present a concept of interconnected individuals or ideas, centering on a large portrait. The visual language is modern yet textured, using muted greens and sharp lines to imply relationships and flow between subjects.