line chart
4 designs
Showing 4 of 4 (4 total)
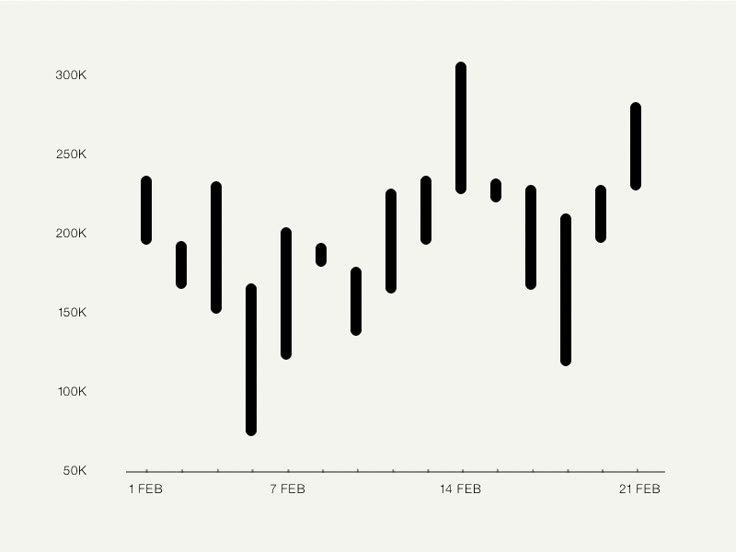
This is a line chart displaying fluctuating data points over time, characterized by a stark, minimalist design focused purely on the visual representation of the trend. The chart uses high contrast between the black data line and the light background to emphasize volatility in the measured values.
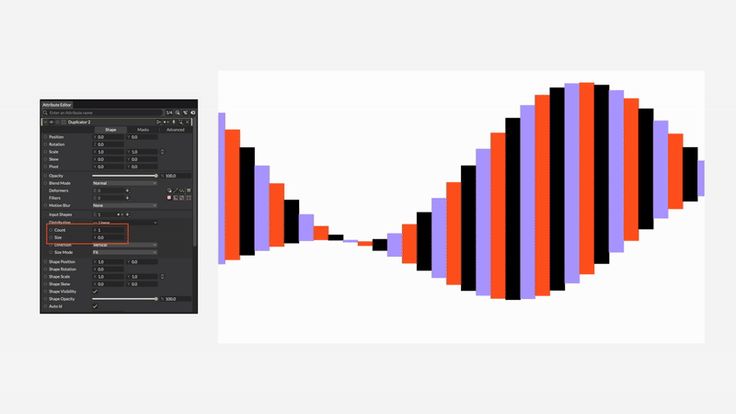
The image presents a financial or data visualization chart characterized by a dramatic, symmetrical curve rendered in vertical bars of varying colors. The design is clean and modern, focusing heavily on the visual representation of fluctuating data over time.
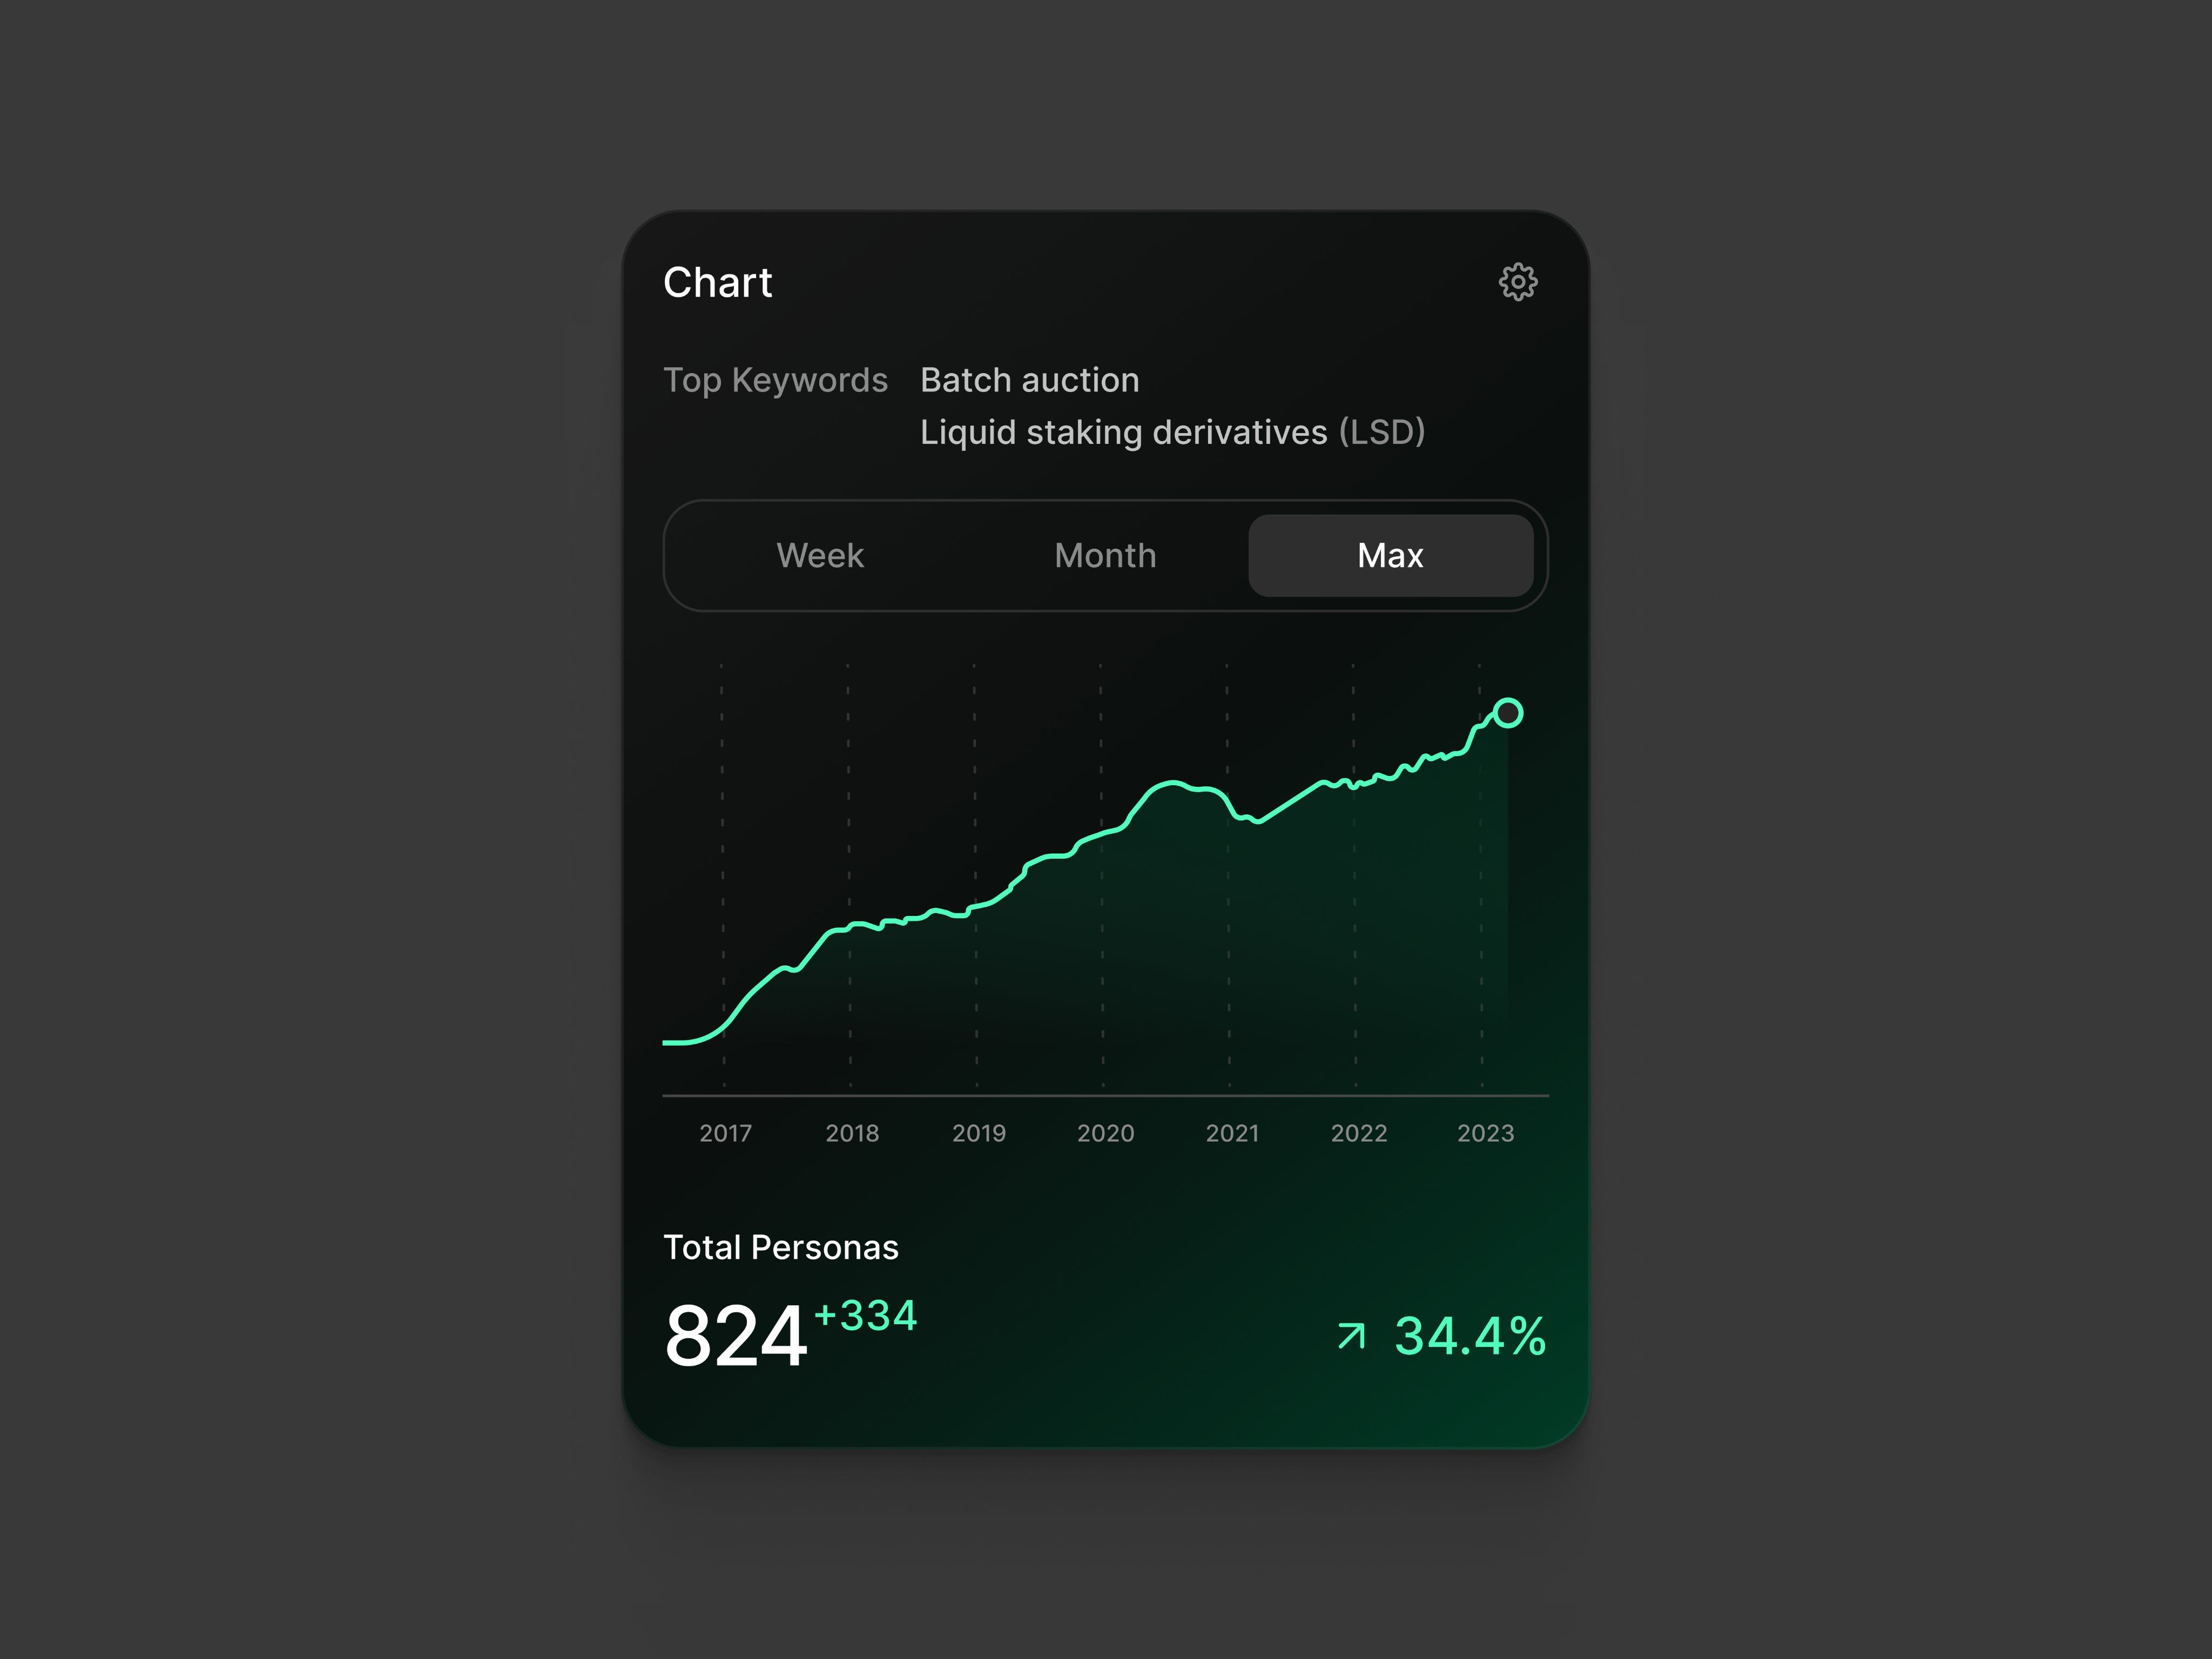
The chart presents a clean, dark-themed data visualization with a strong emphasis on a green line graph against a dark background. The design is modern and functional, prioritizing data clarity through simple axis labeling and clear segmentation.
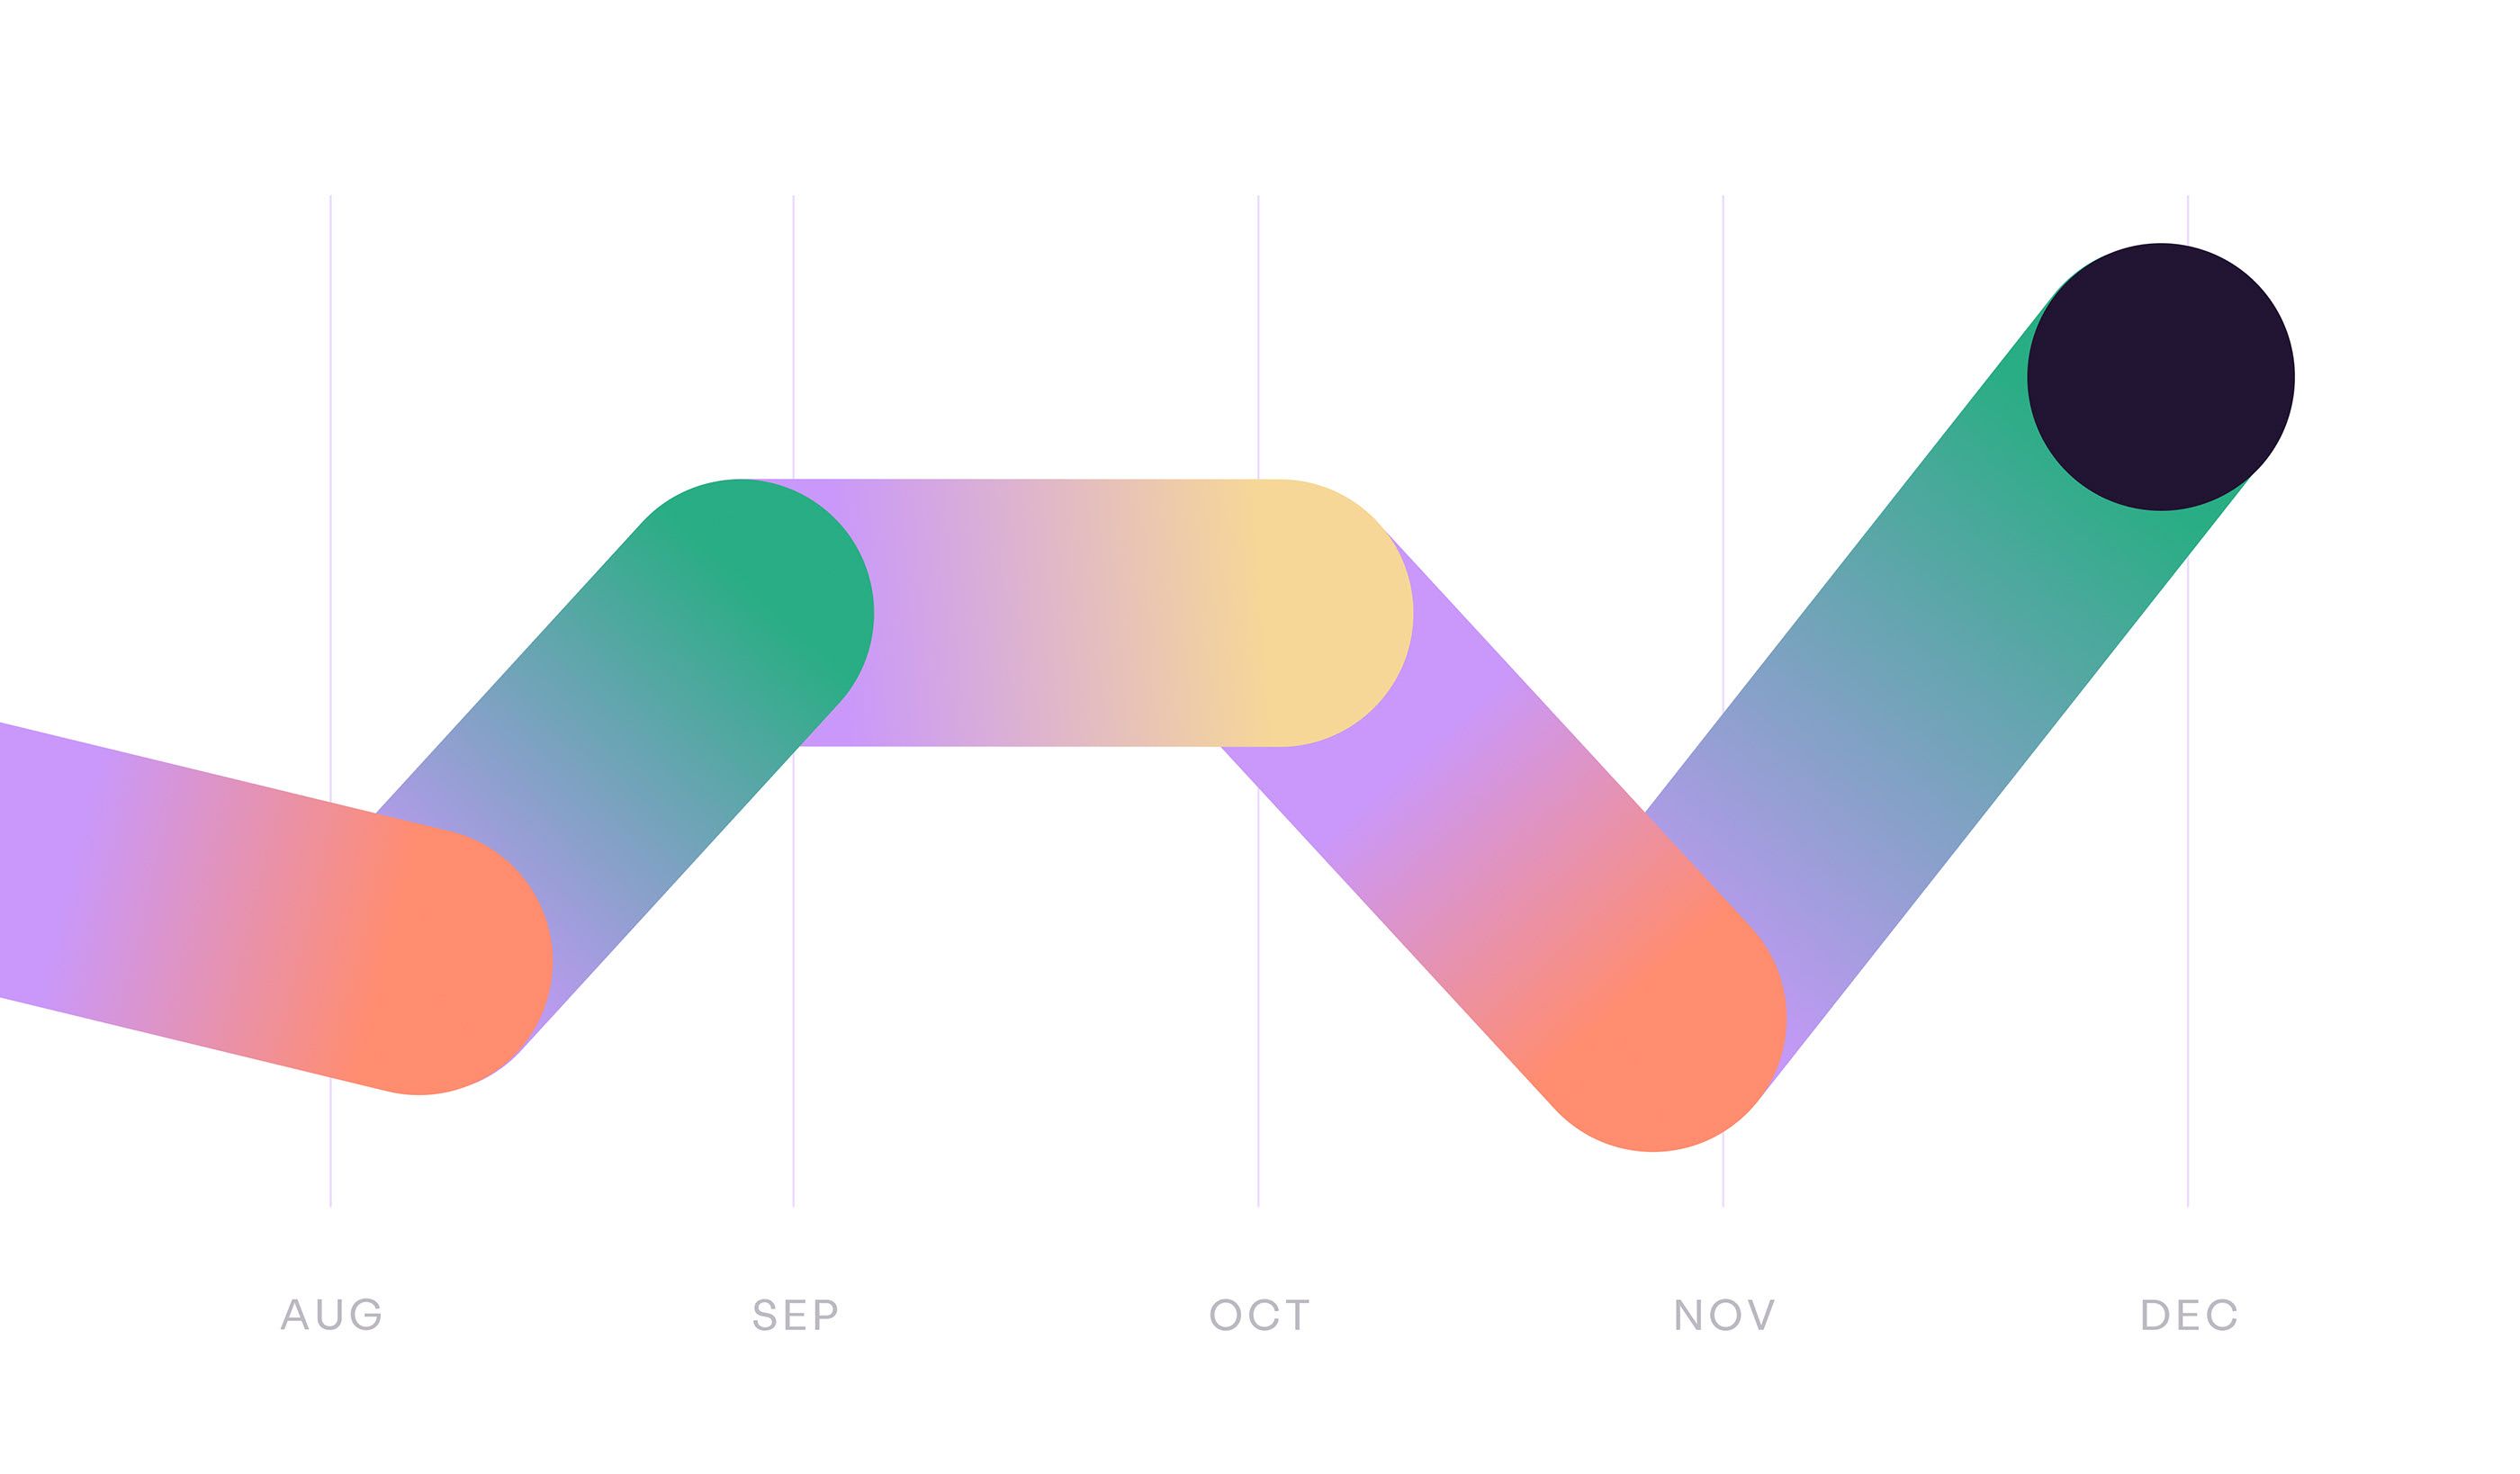
This is a minimalist, line-based infographic or timeline visualization showing a fluctuating trend over a year. The design uses smooth, curved segments to imply movement or change across discrete monthly points.