infographic
270 designs
Showing 24 of 270 (270 total)
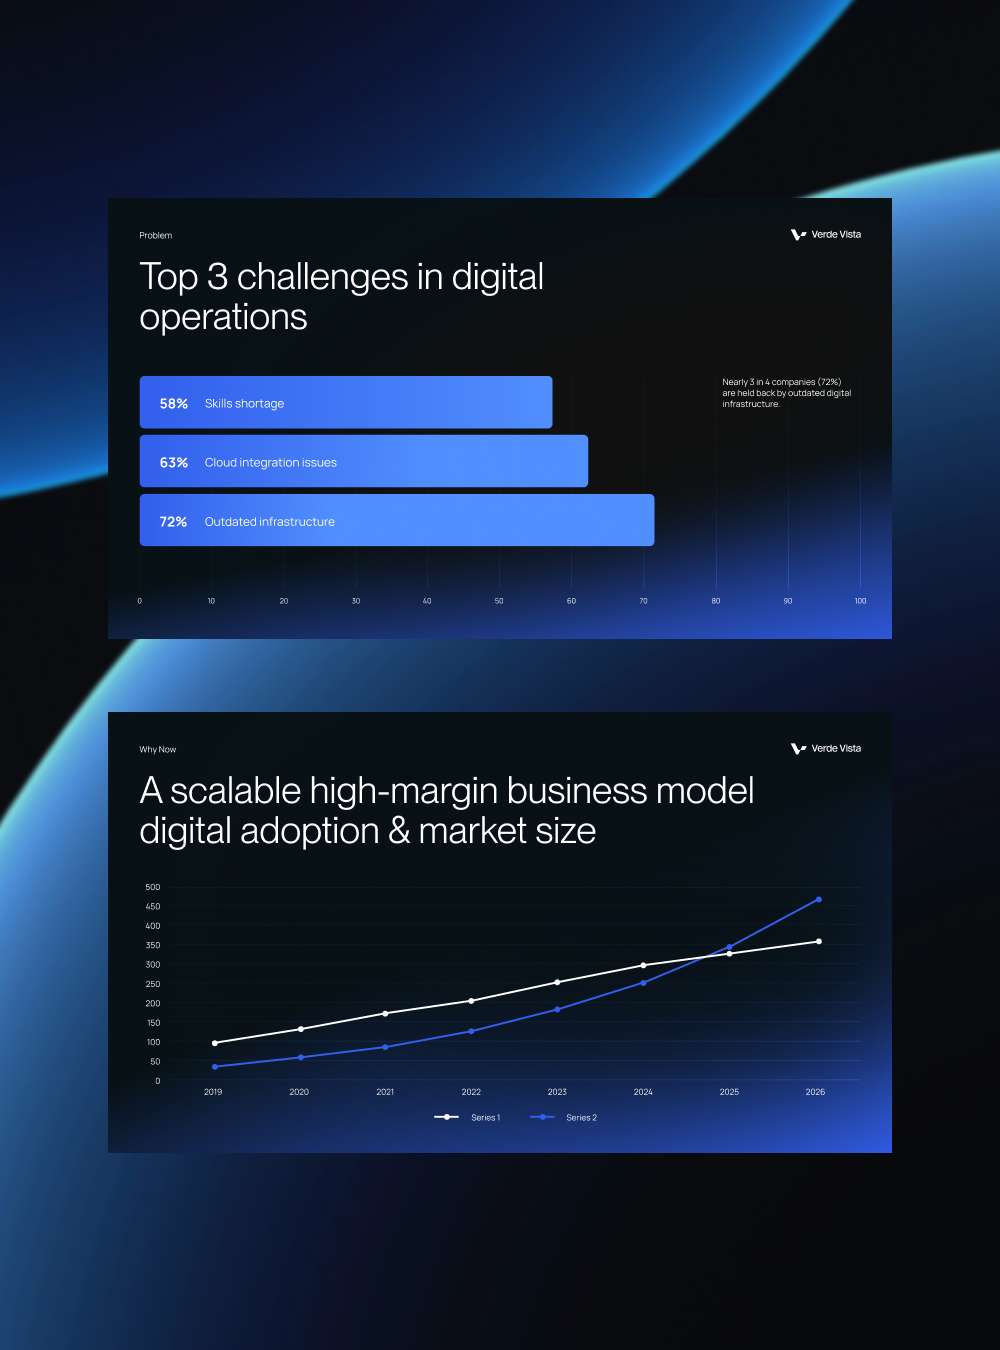
This image presents two distinct data visualizations set against a deep blue background, emphasizing corporate and analytical reporting. The design utilizes clear bar charts and line graphs to communicate complex business challenges and growth trends effectively.
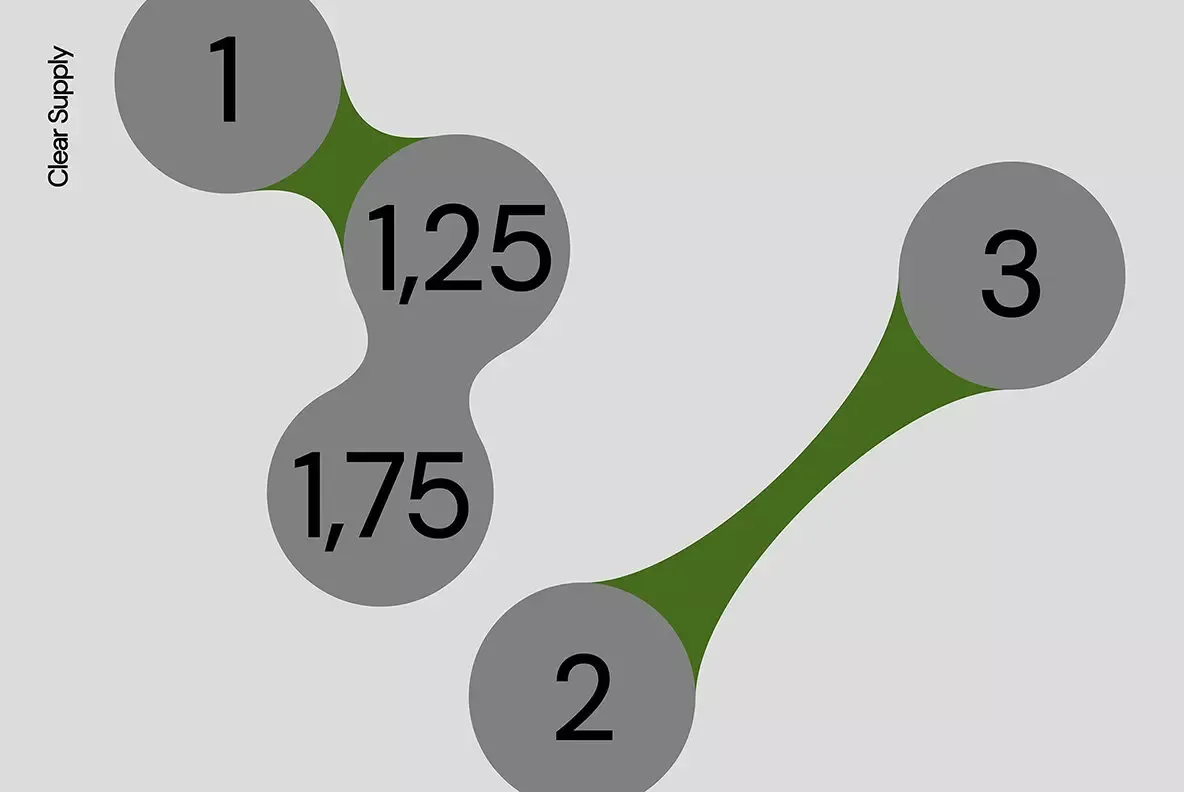
This is a clean, minimalist infographic design utilizing organic, irregular shapes to represent interconnected data points or steps. The visual language relies on subtle tonal variations between gray and olive green to establish hierarchy and connection.
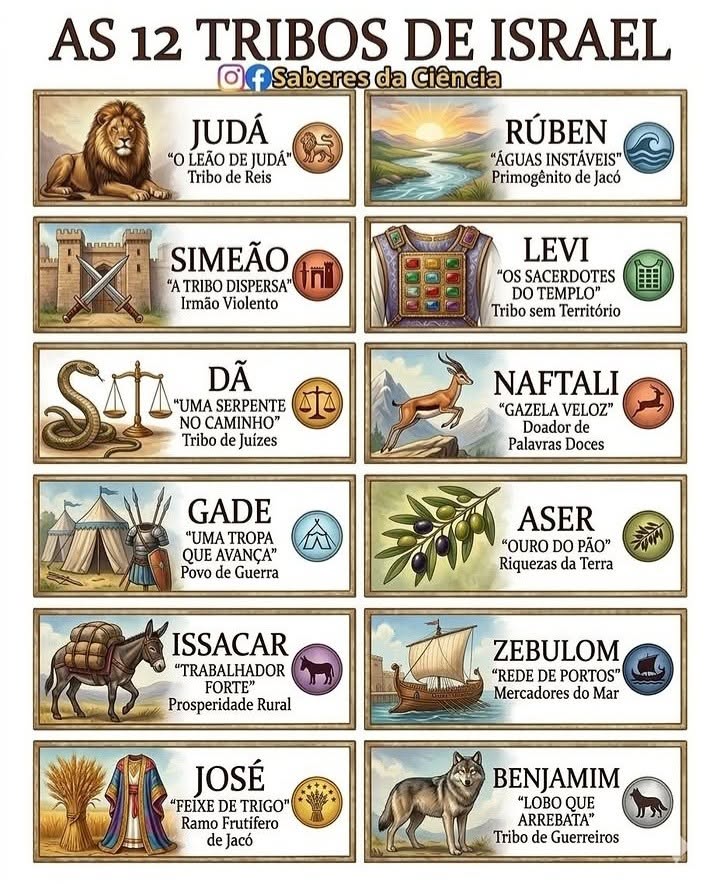
This is a highly structured infographic design utilizing detailed illustrative icons paired with textual information to present historical or religious data. The visual language is rich in earthy tones and detailed engravings, creating a sense of ancient authority and educational depth. The composition is clean and modular, making the twelve entries easily digestible.
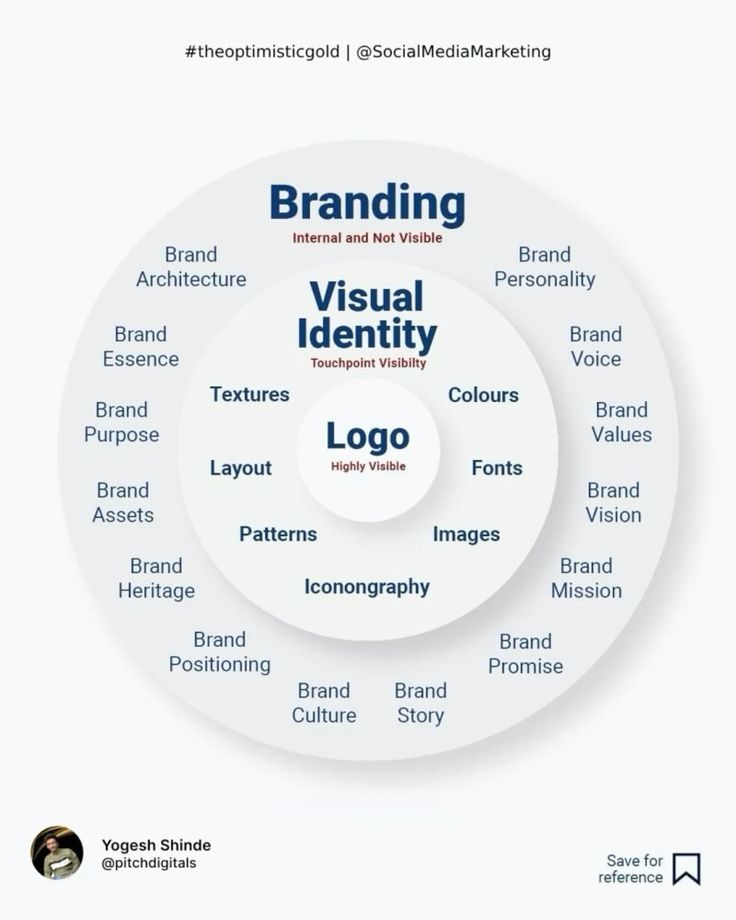
This is a clean, professional infographic utilizing a radial layout to map out the components of visual identity and branding. The design effectively uses concentric circles to show hierarchical relationships between core concepts, making complex information highly digestible.
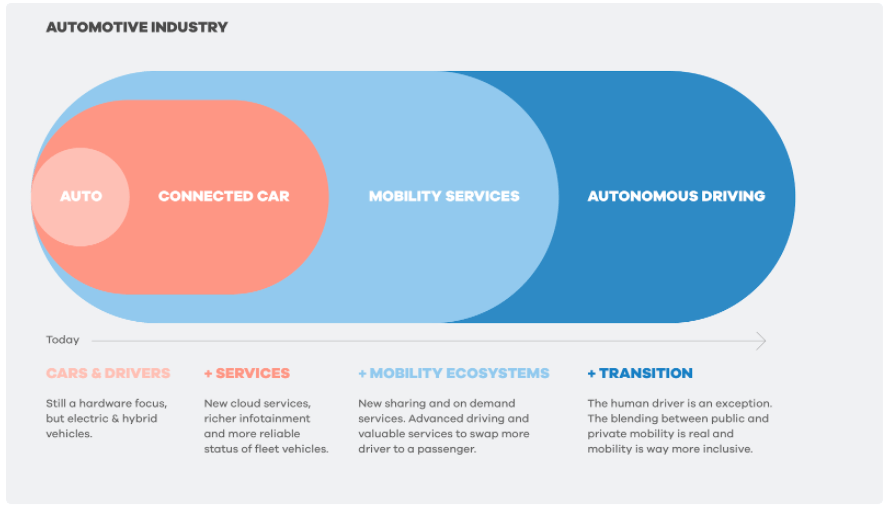
This infographic uses a clean, modern flat design approach to segment and illustrate different facets of the automotive industry. The visual language relies heavily on large, soft color blocks to clearly delineate categories and show relationships between them. The overall feel is professional, organized, and forward-looking.
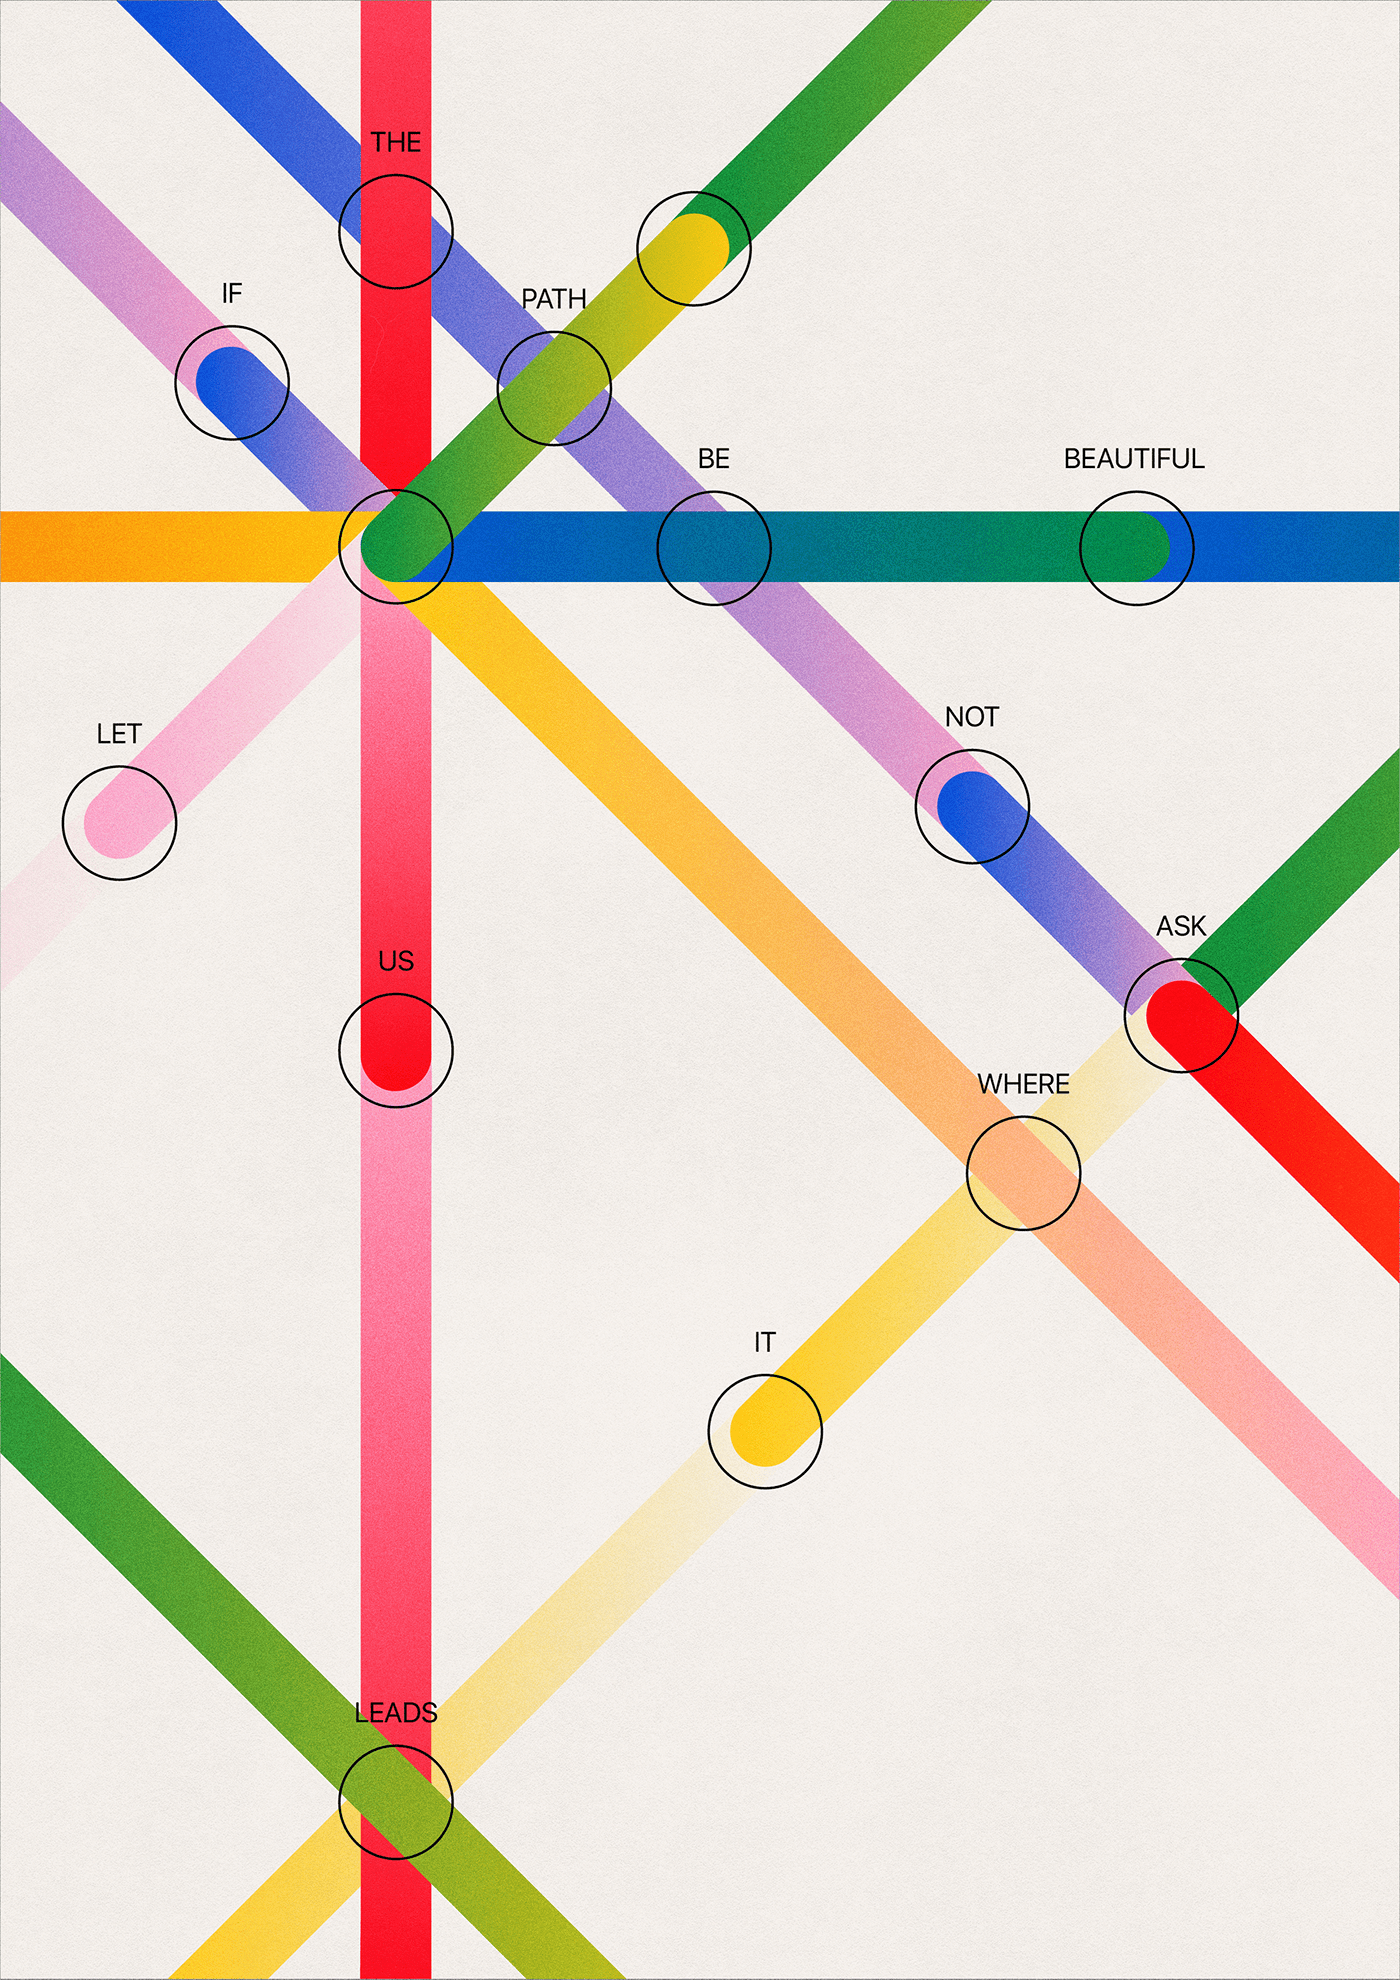
This image presents a vibrant, abstract diagram utilizing intersecting lines and colored nodes to illustrate conceptual relationships between various terms. The visual language is clean and structured, relying heavily on color coding to differentiate pathways and connections.

This is a vibrant, modern infographic design utilizing flat design principles combined with subtle gradients to convey themes of growth and financial success. The visual language is clean, utilizing geometric shapes and symbolic elements like a rocket and bar charts to represent progress. The overall feel is optimistic, dynamic, and professional.
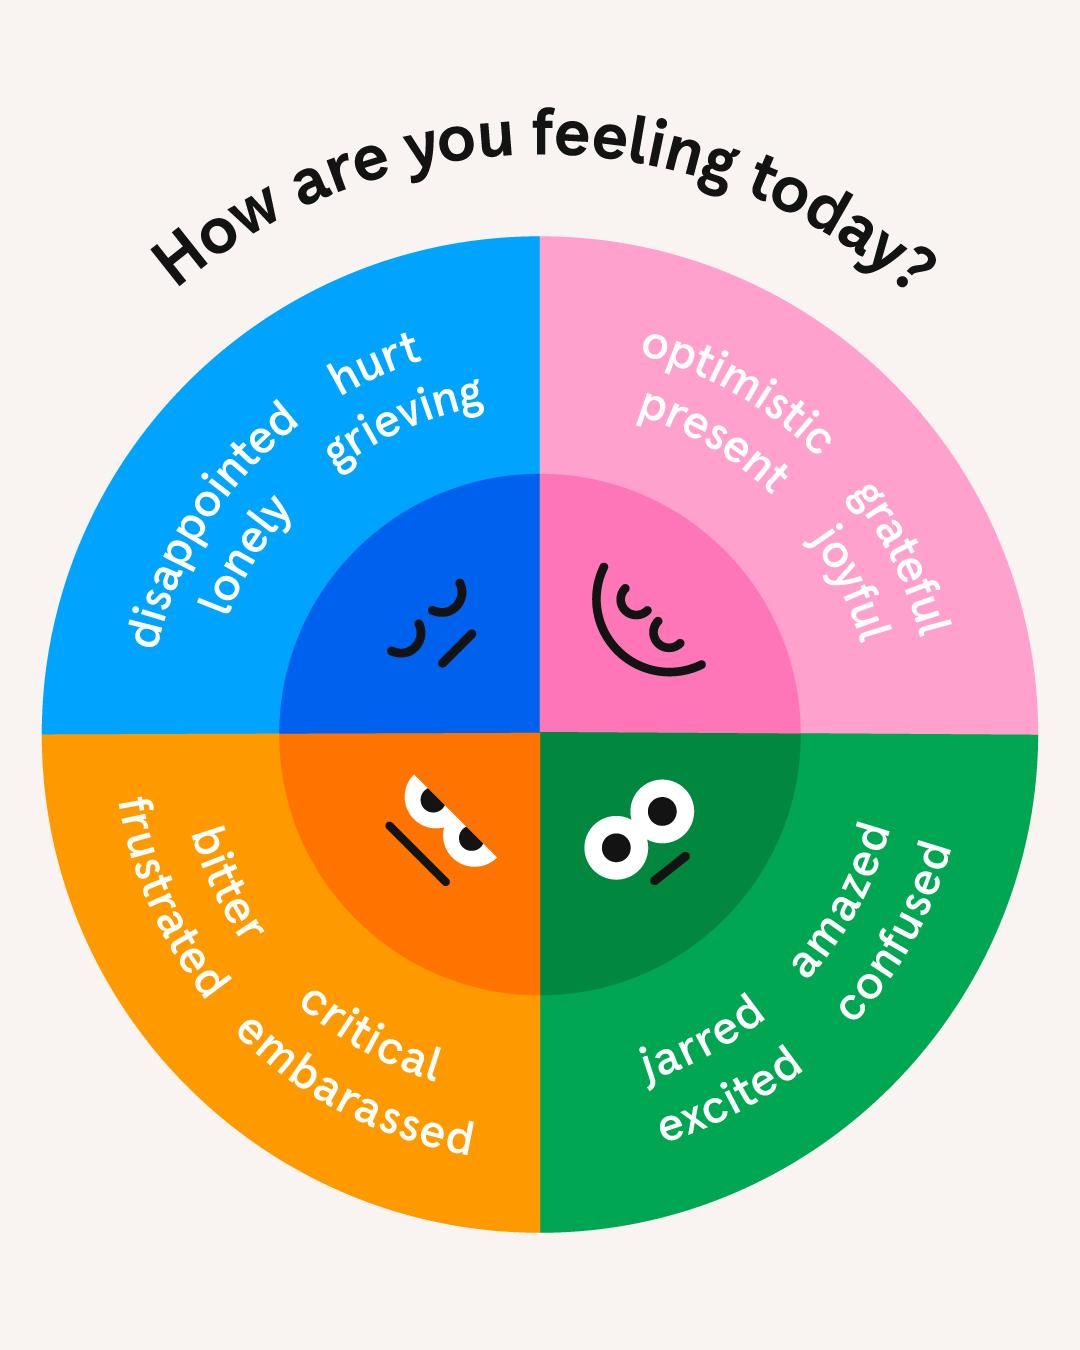
This is a vibrant, flat design infographic that uses a circular layout to map various emotional states. The visual language relies on distinct color segmentation to categorize complex feelings into easily digestible segments.
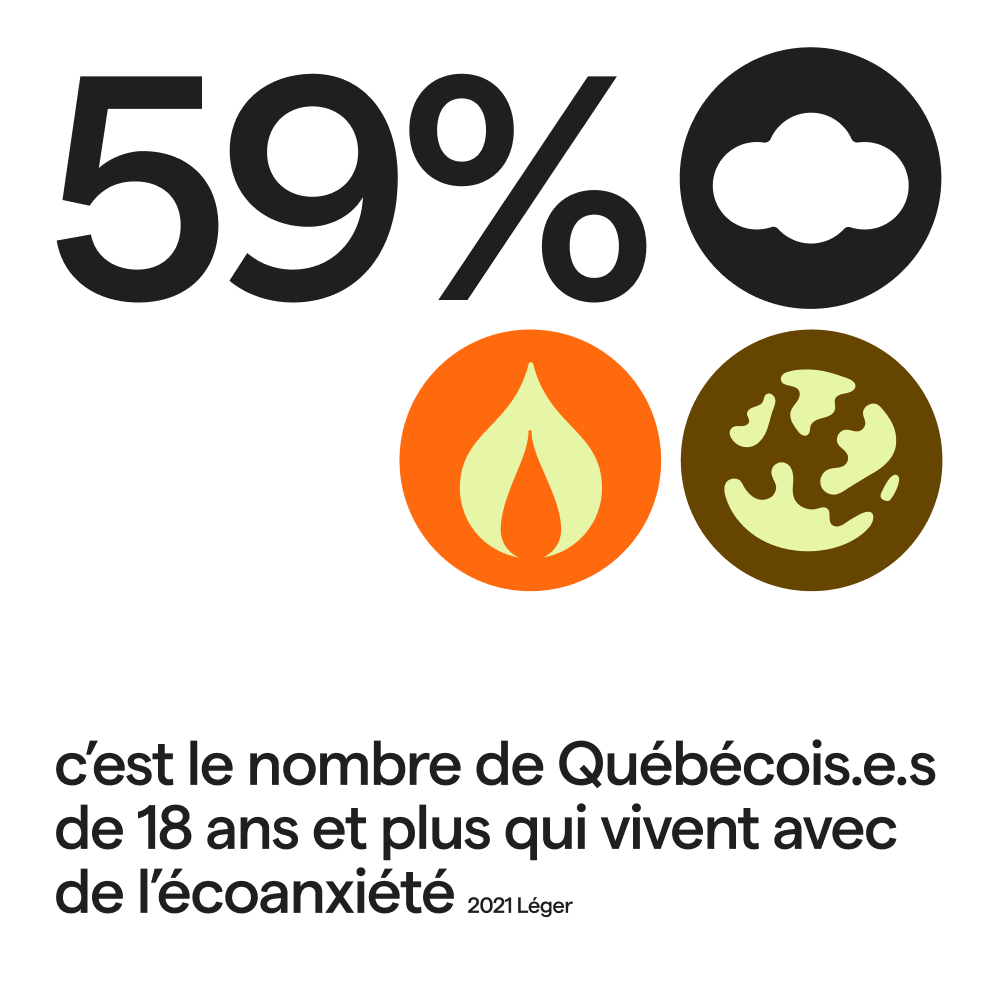
This is a clean, data-driven infographic design utilizing bold typography and symbolic icons to present a statistic. The visual language is stark and modern, relying on high contrast between black elements and warm, earthy tones to convey serious information.
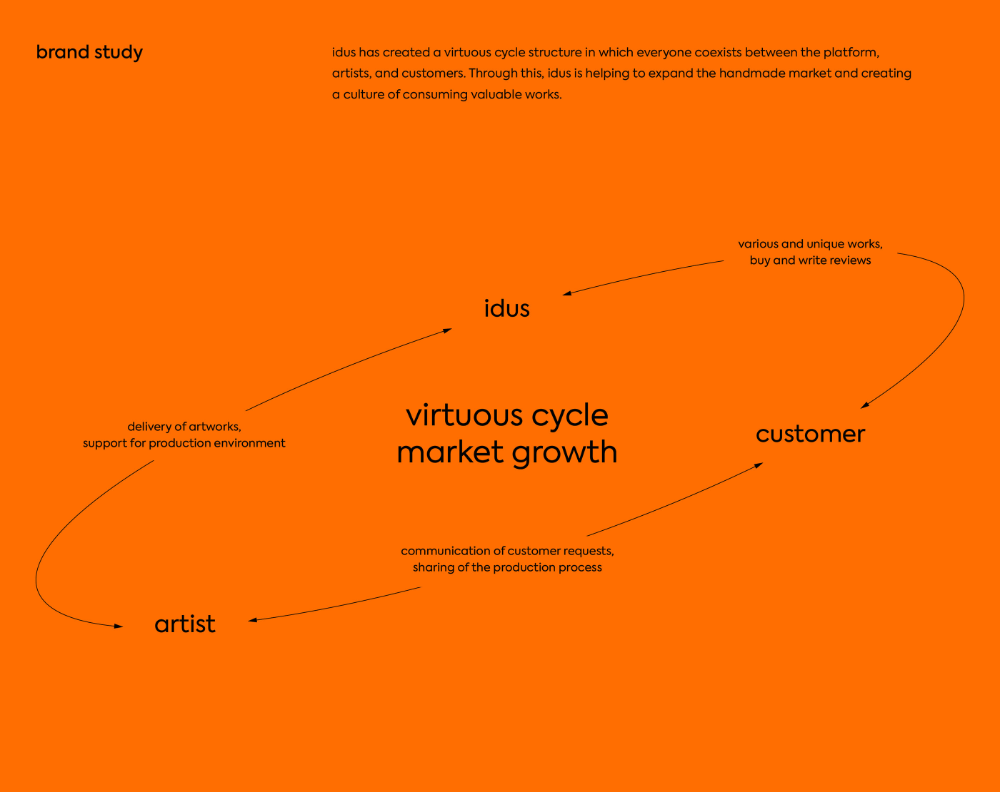
This is an energetic infographic illustrating a virtuous cycle between artists and customers, emphasizing growth and communication. The design relies on smooth, flowing lines in a vibrant orange to convey interconnectedness and positive momentum.
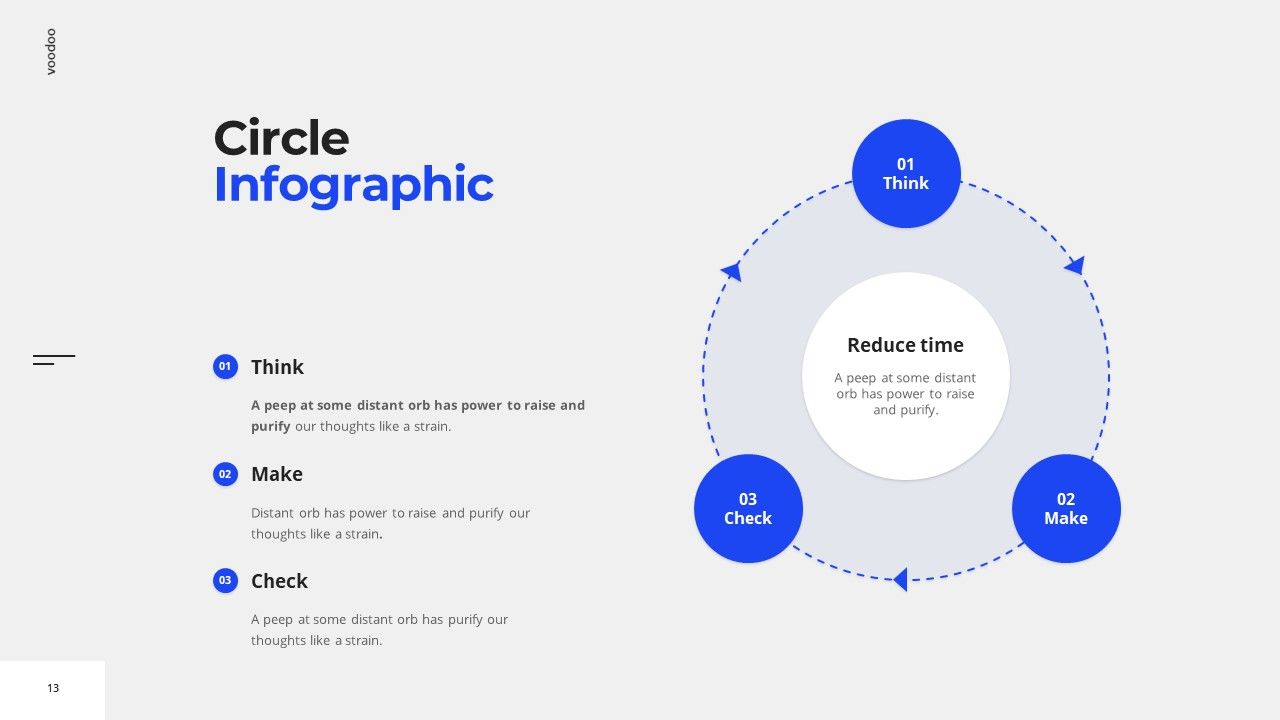
This is a clean, modern circular infographic template designed to illustrate a sequential process. The visual language relies on simple geometry and clear delineation to guide the viewer through three distinct steps effectively.
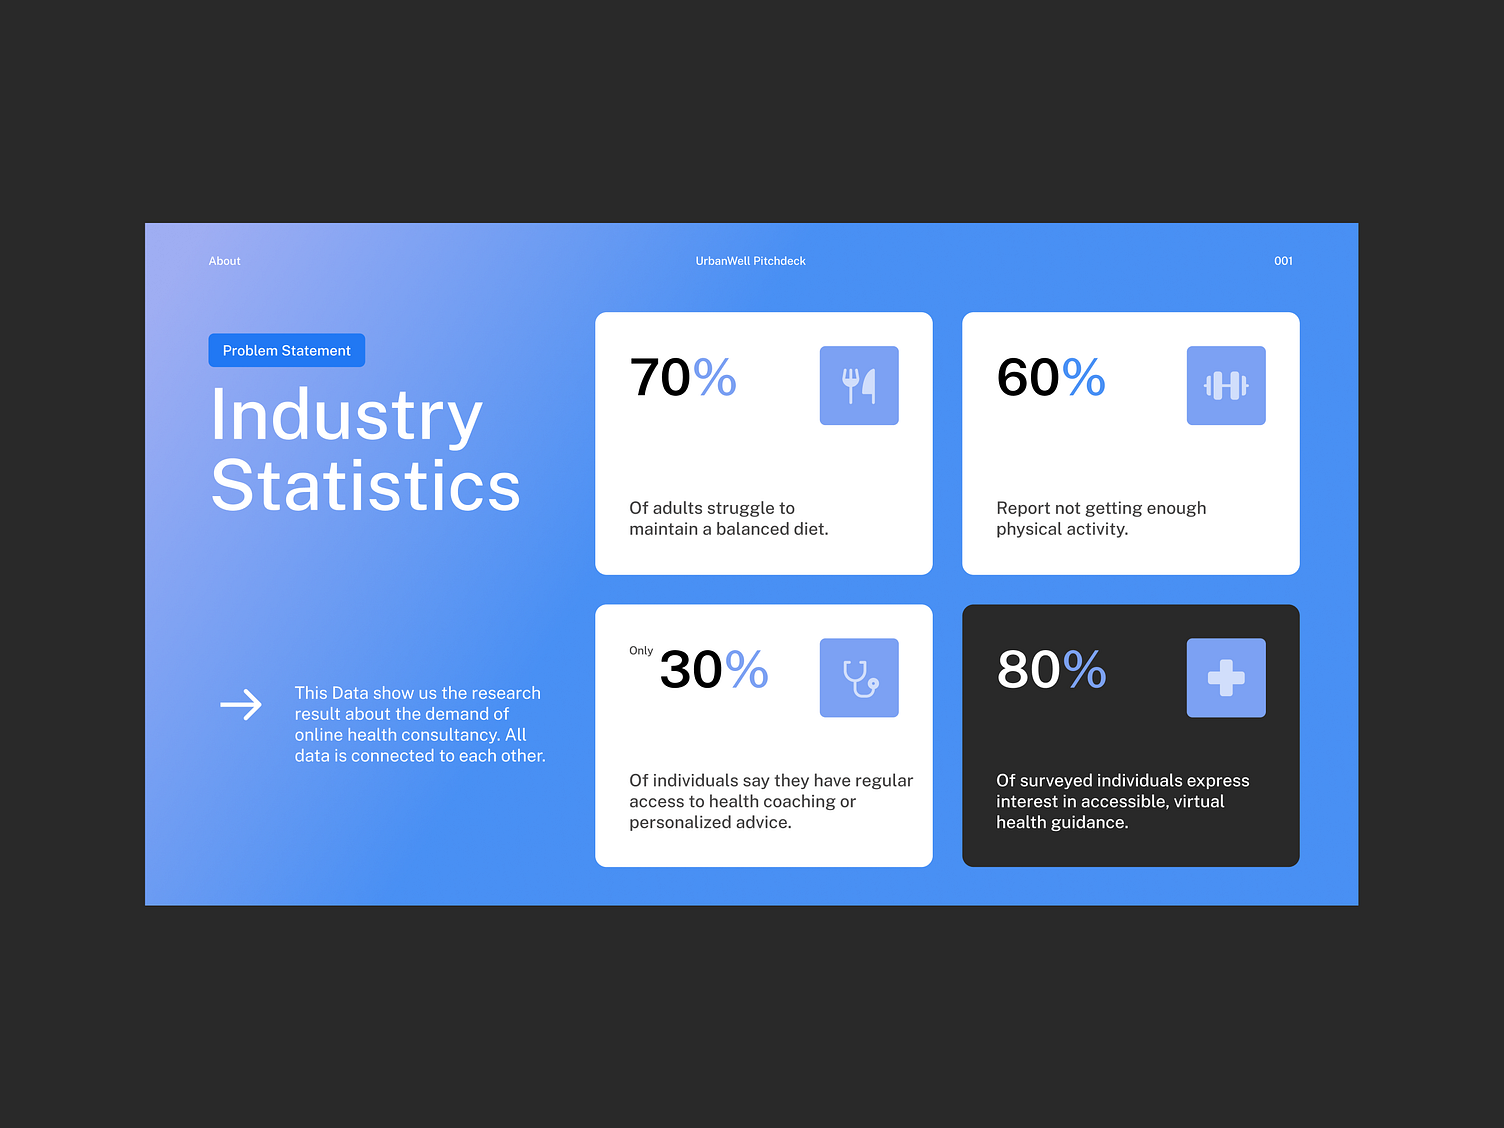
This is a clean, professional infographic designed to present industry statistics using clear percentage callouts and associated text blocks. The visual language relies on strong segmentation and a cool color palette to facilitate easy data comprehension.
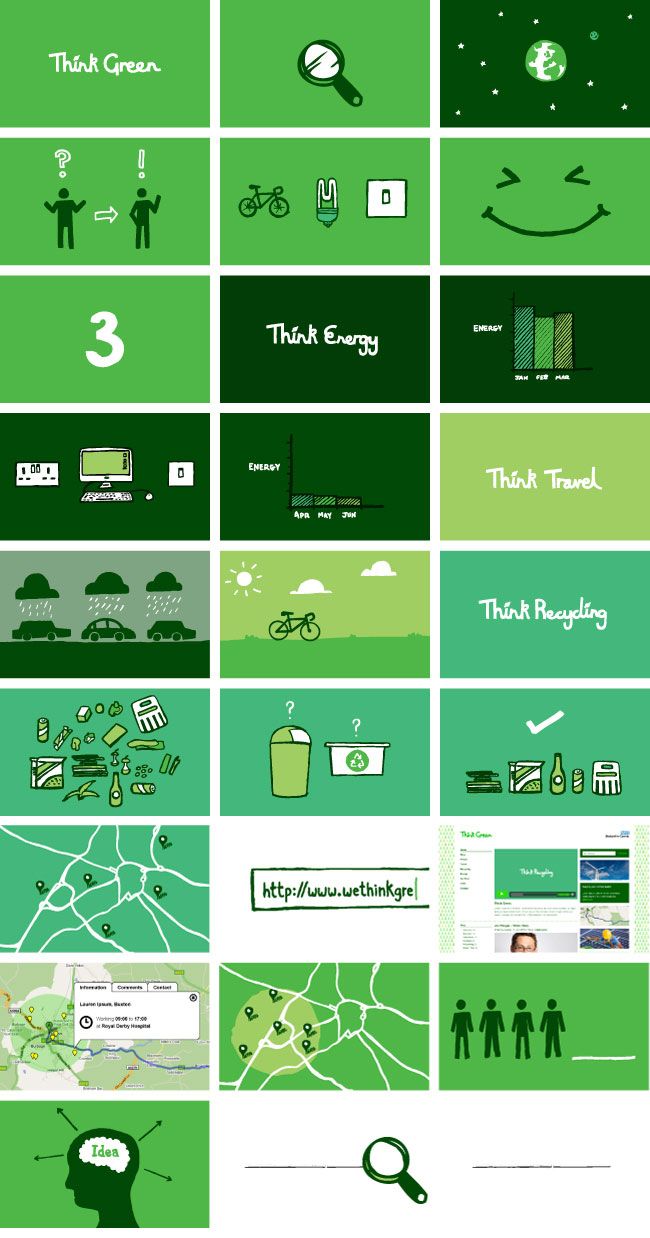
This is a clean, educational infographic utilizing a vibrant green palette and a structured grid layout to convey environmental concepts. The design is highly organized, using simple icons and clear text to break down complex ideas into digestible segments.
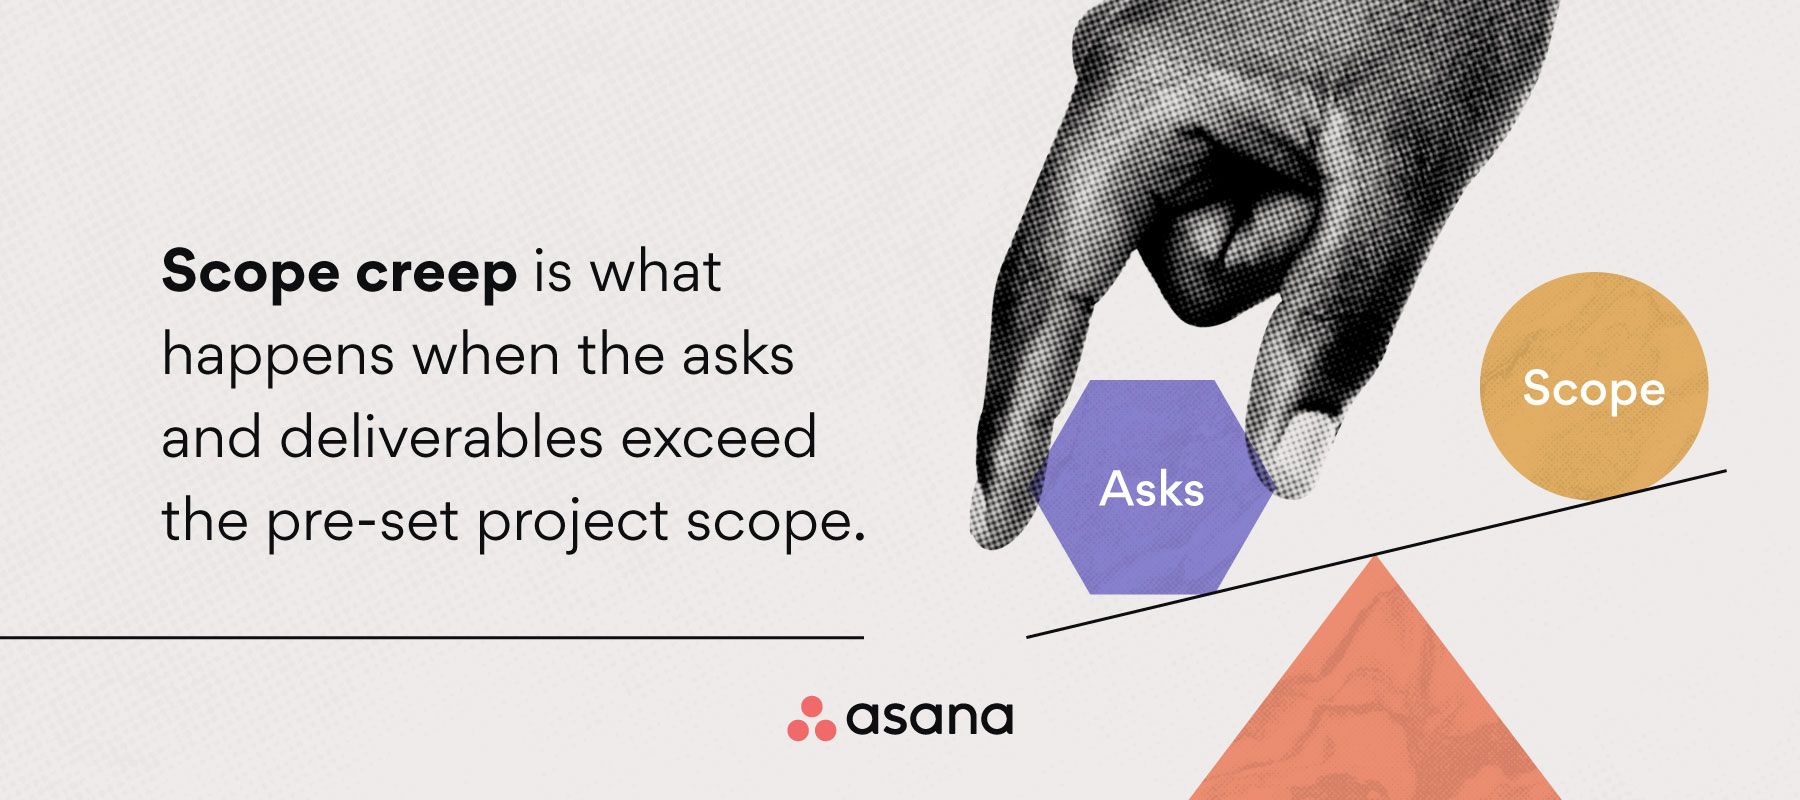
This is a clean, professional infographic design using simple geometric shapes and limited color contrast to explain a project management concept. The visual language is modern and analytical, effectively uses negative space to draw attention to the relationship between 'Scope' and 'Asks.'
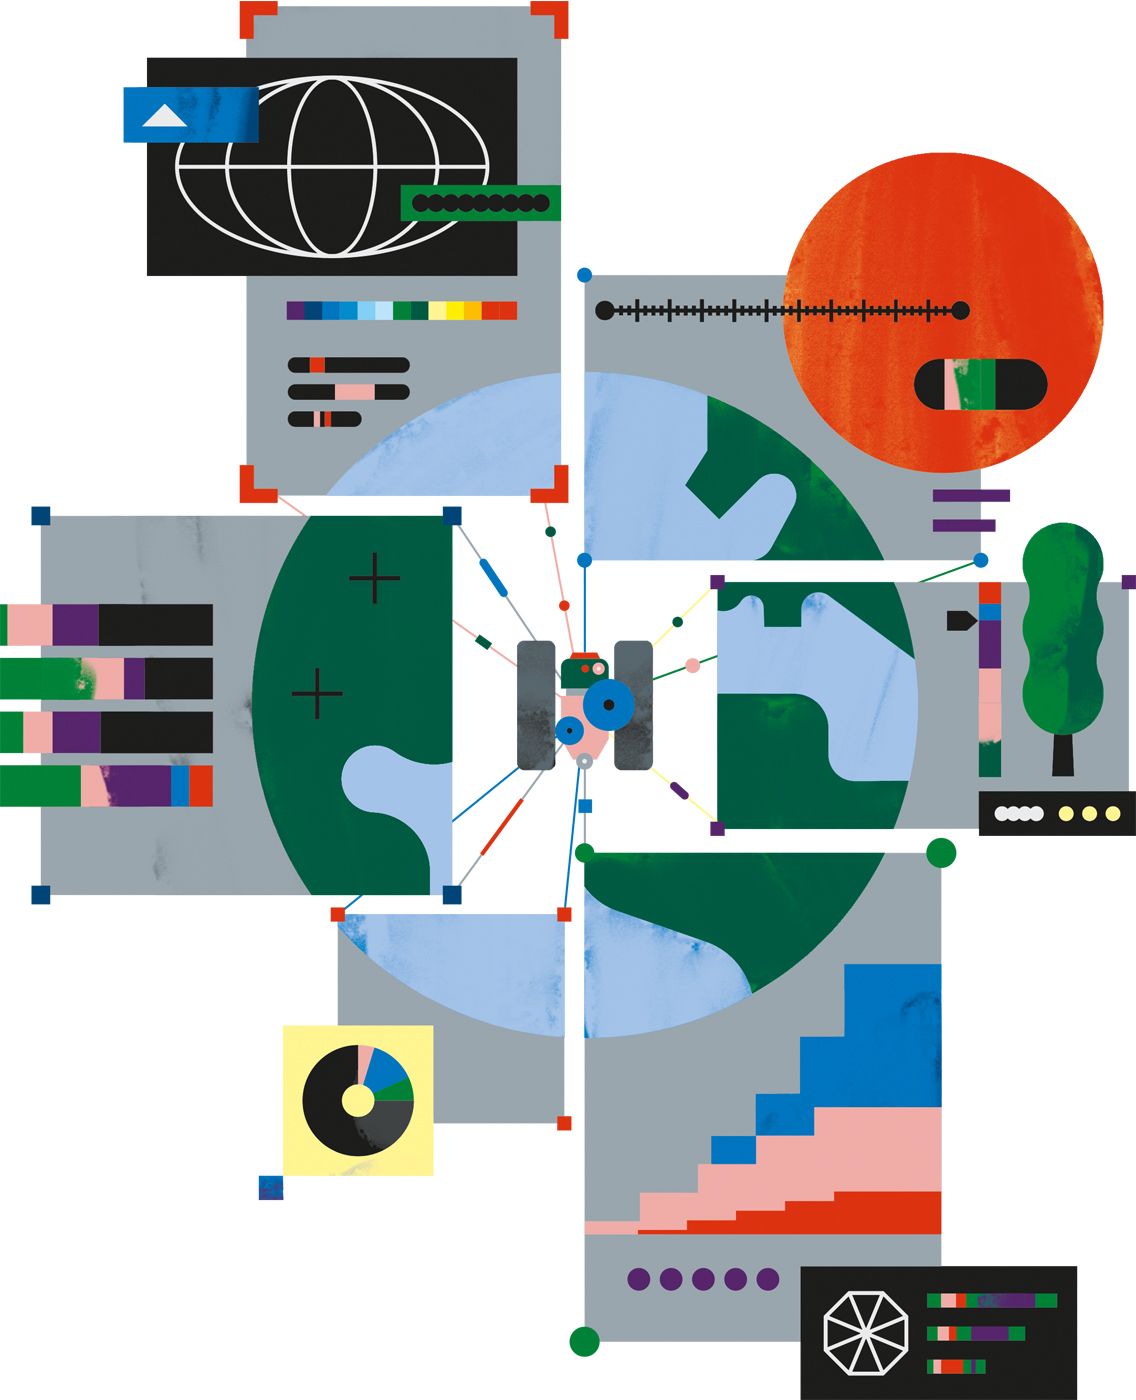
This is a complex, modular data visualization characterized by clean geometric shapes and interconnected lines. The visual language emphasizes structure, connectivity, and the mapping of abstract information into a coherent diagrammatic system. The overall feel is highly technical and analytical.
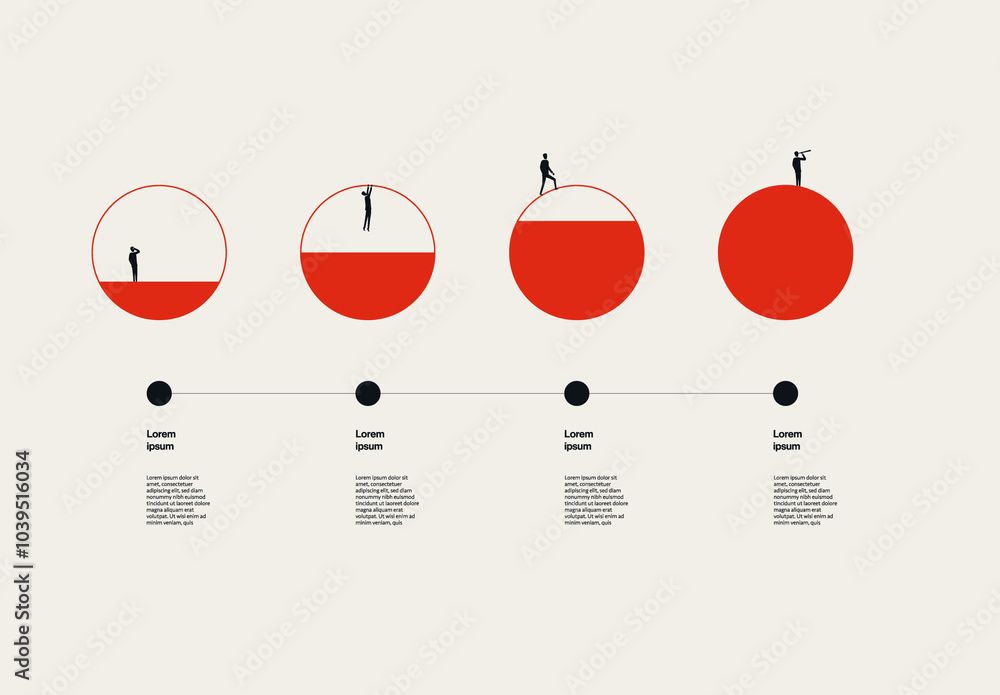
This design utilizes a clean, minimalist approach to visualize a four-step process or timeline using circular icons. The visual language relies on strong color contrast between the warm red and the neutral background, creating a structured and professional feel.
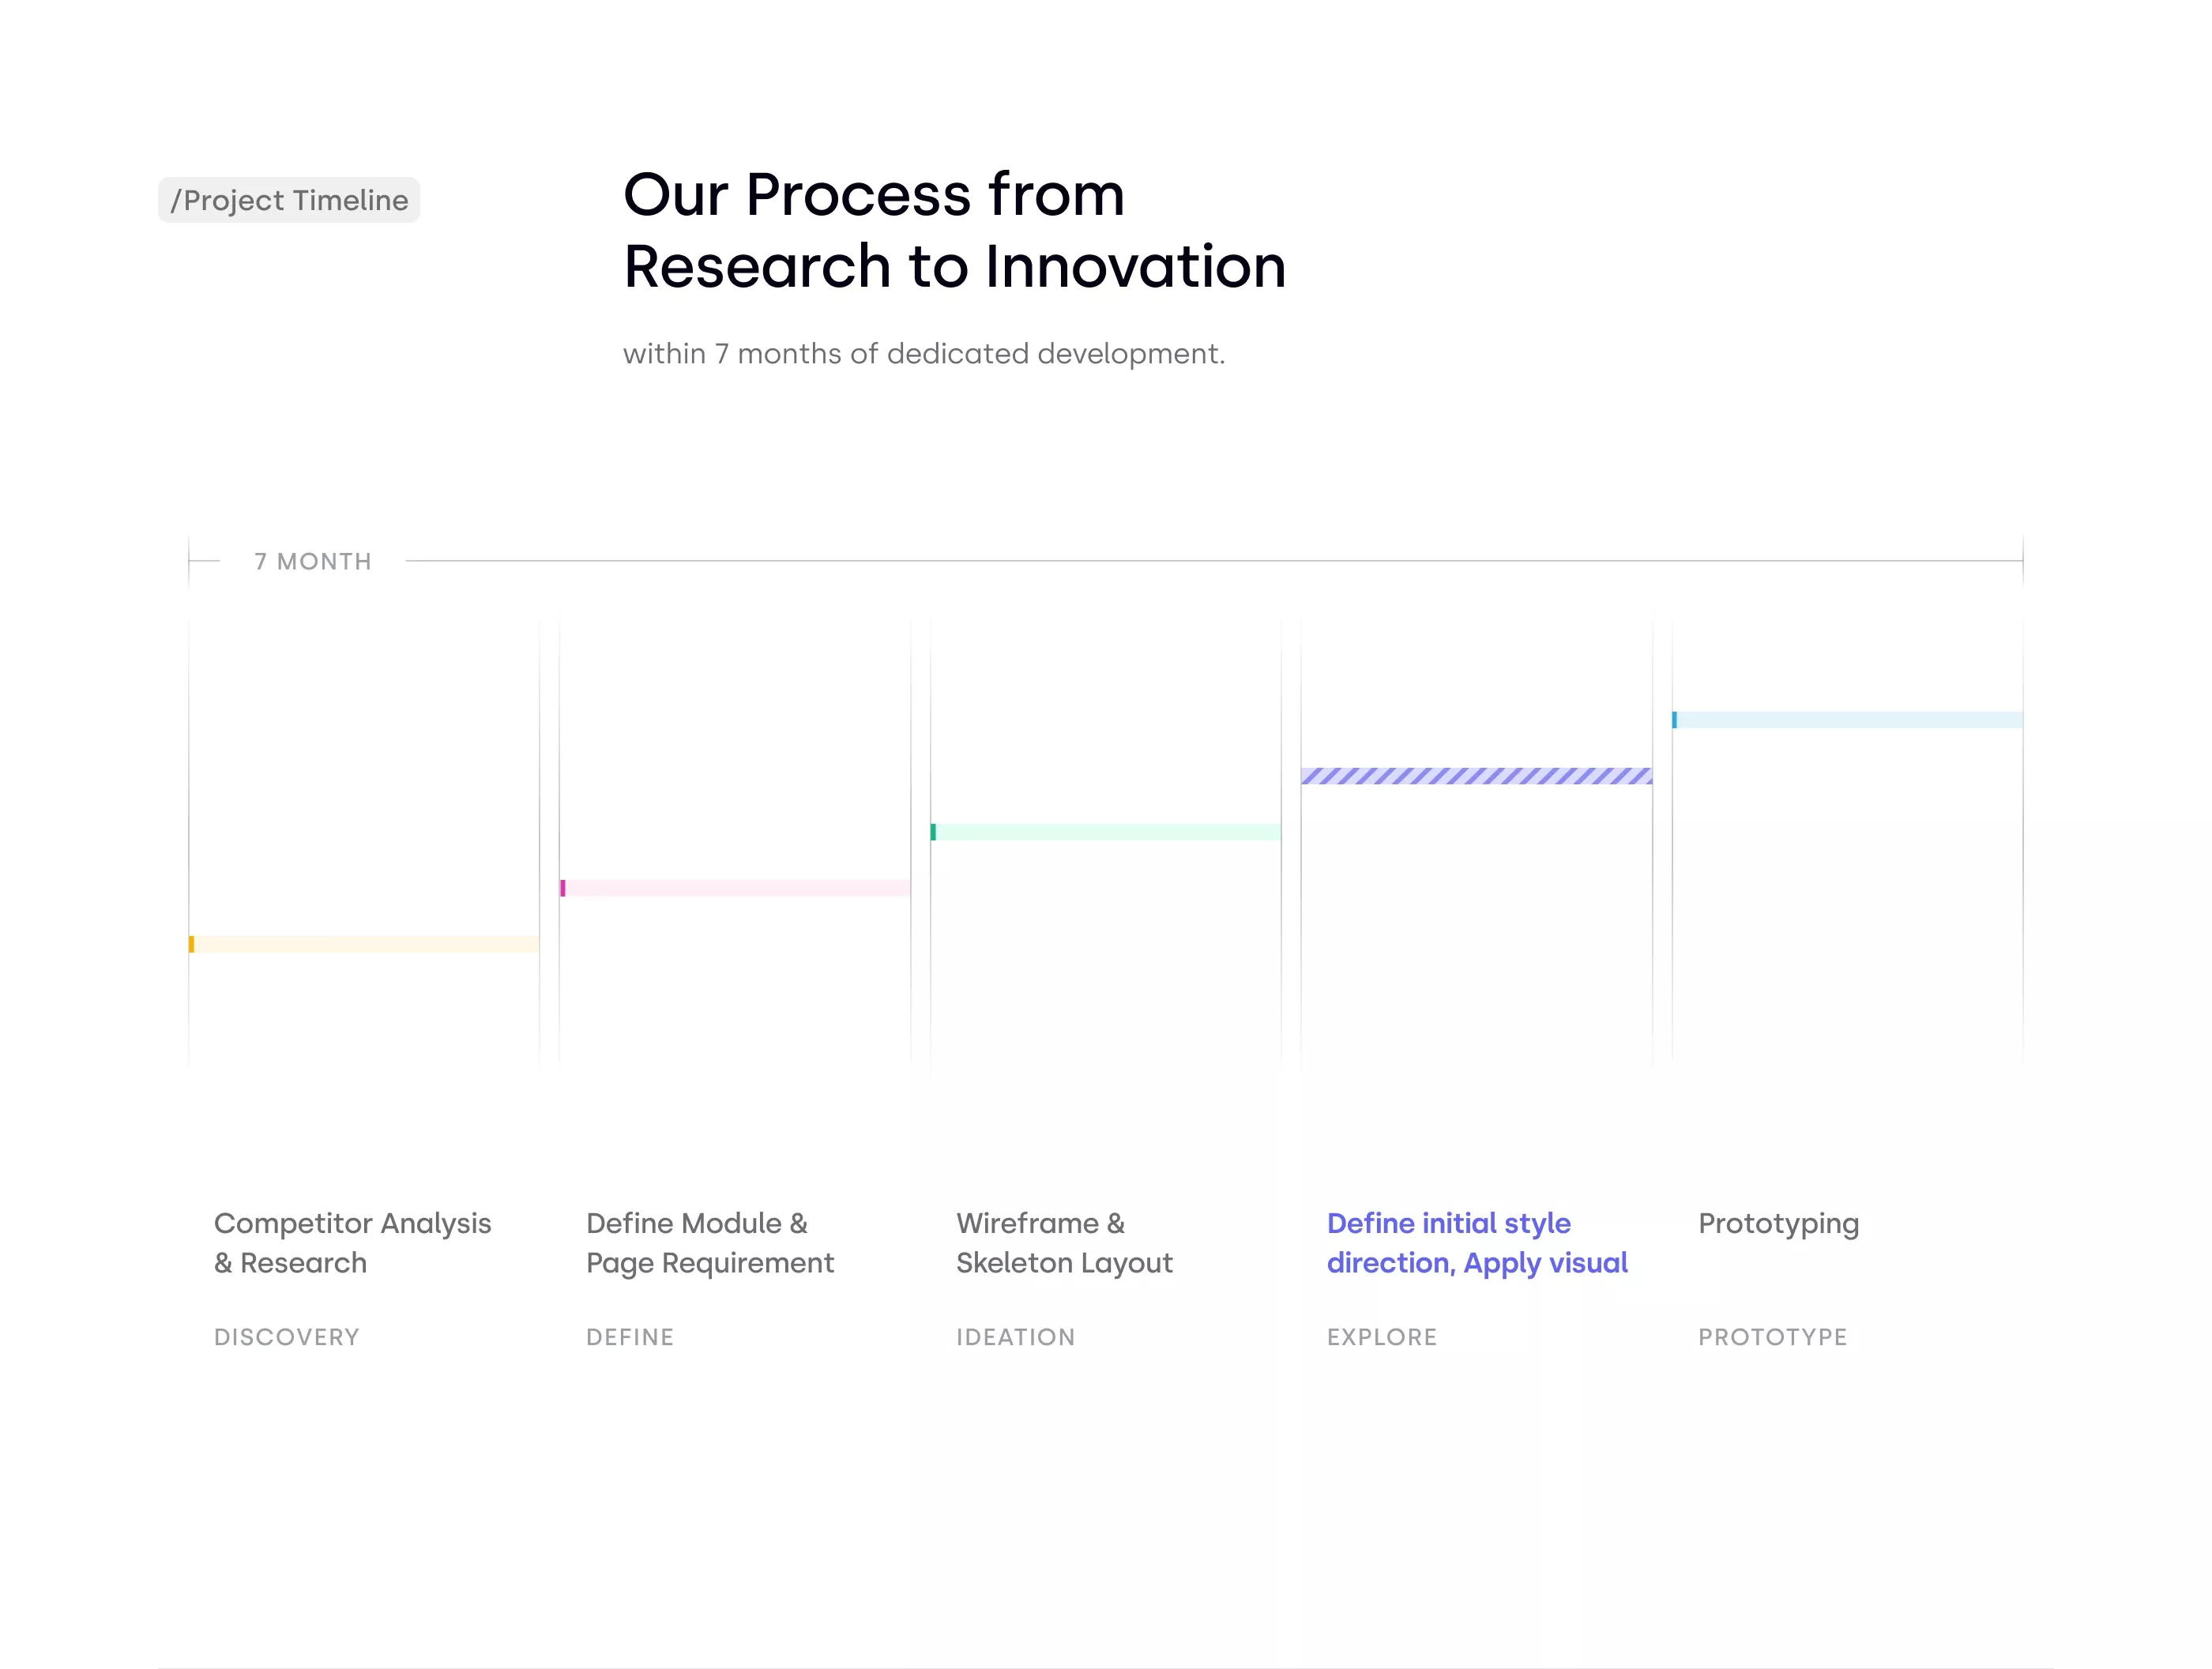
This is a clean, professional infographic illustrating a linear project development process. The design uses subtle color coding and clear text labels to guide the viewer through sequential stages, emphasizing structure and methodical progression.
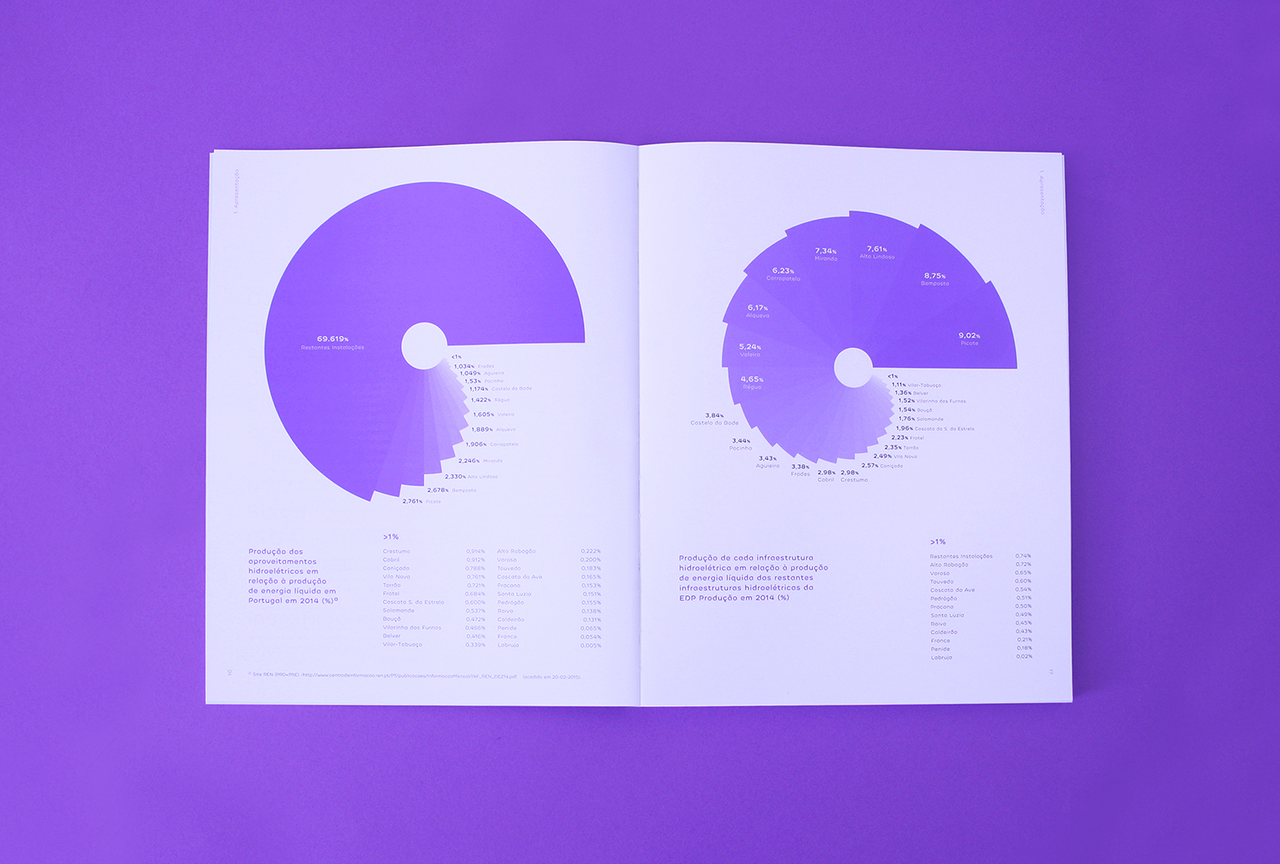
This spread features a clean, professional presentation of quantitative data using large circular charts against a stark white background. The design emphasizes clarity and readability, utilizing a monochromatic palette of purples and whites to create a modern and analytical feel.
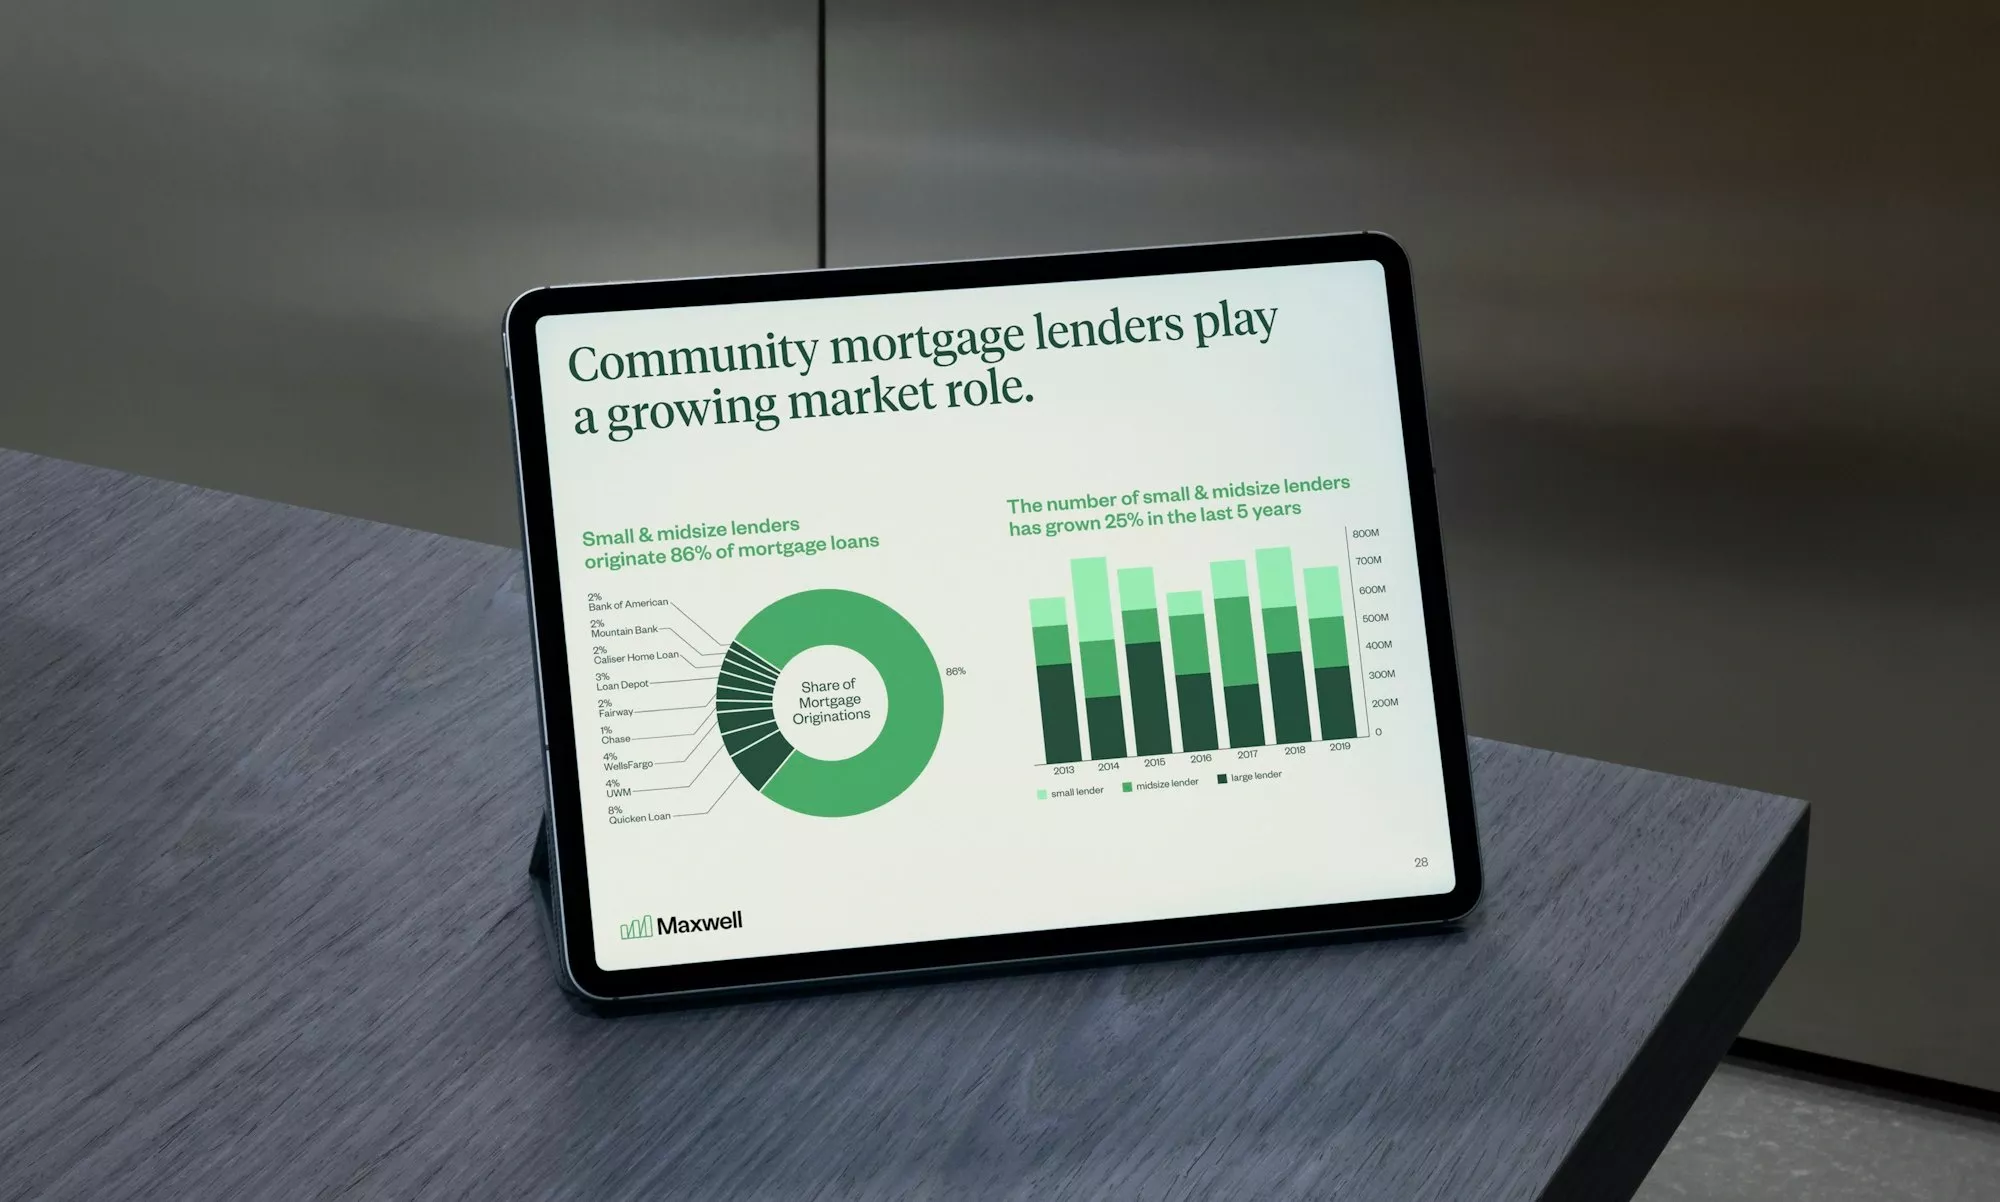
This image showcases a clean, professional data visualization displayed on a digital screen, emphasizing market growth and organizational share. The design utilizes clear graphical elements to present complex financial information in an accessible and modern format.
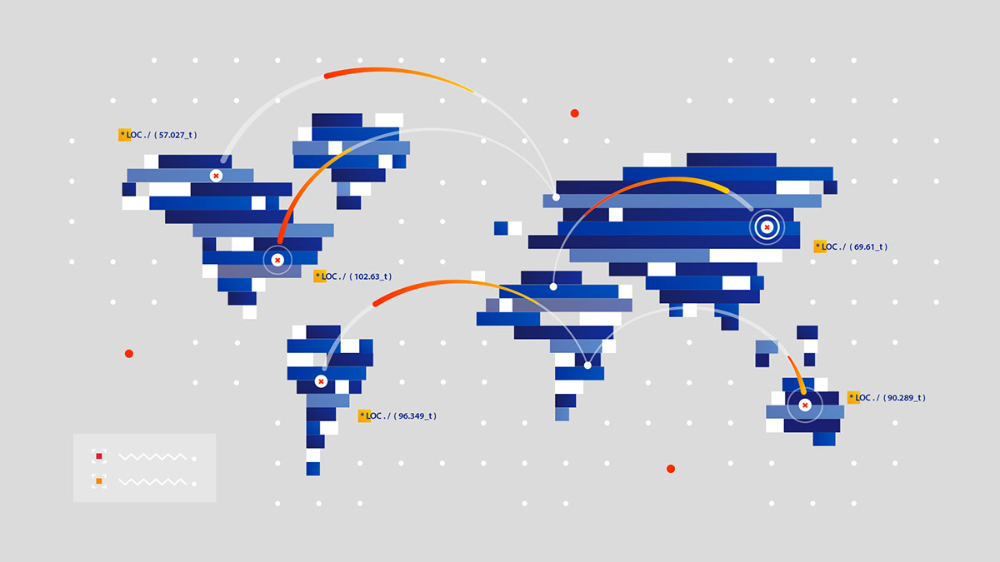
This is a clean, minimalist data visualization using an abstract world map to represent network connections and geographical data. The design effectively uses color contrast and line work to illustrate relationships between various nodes across the map.
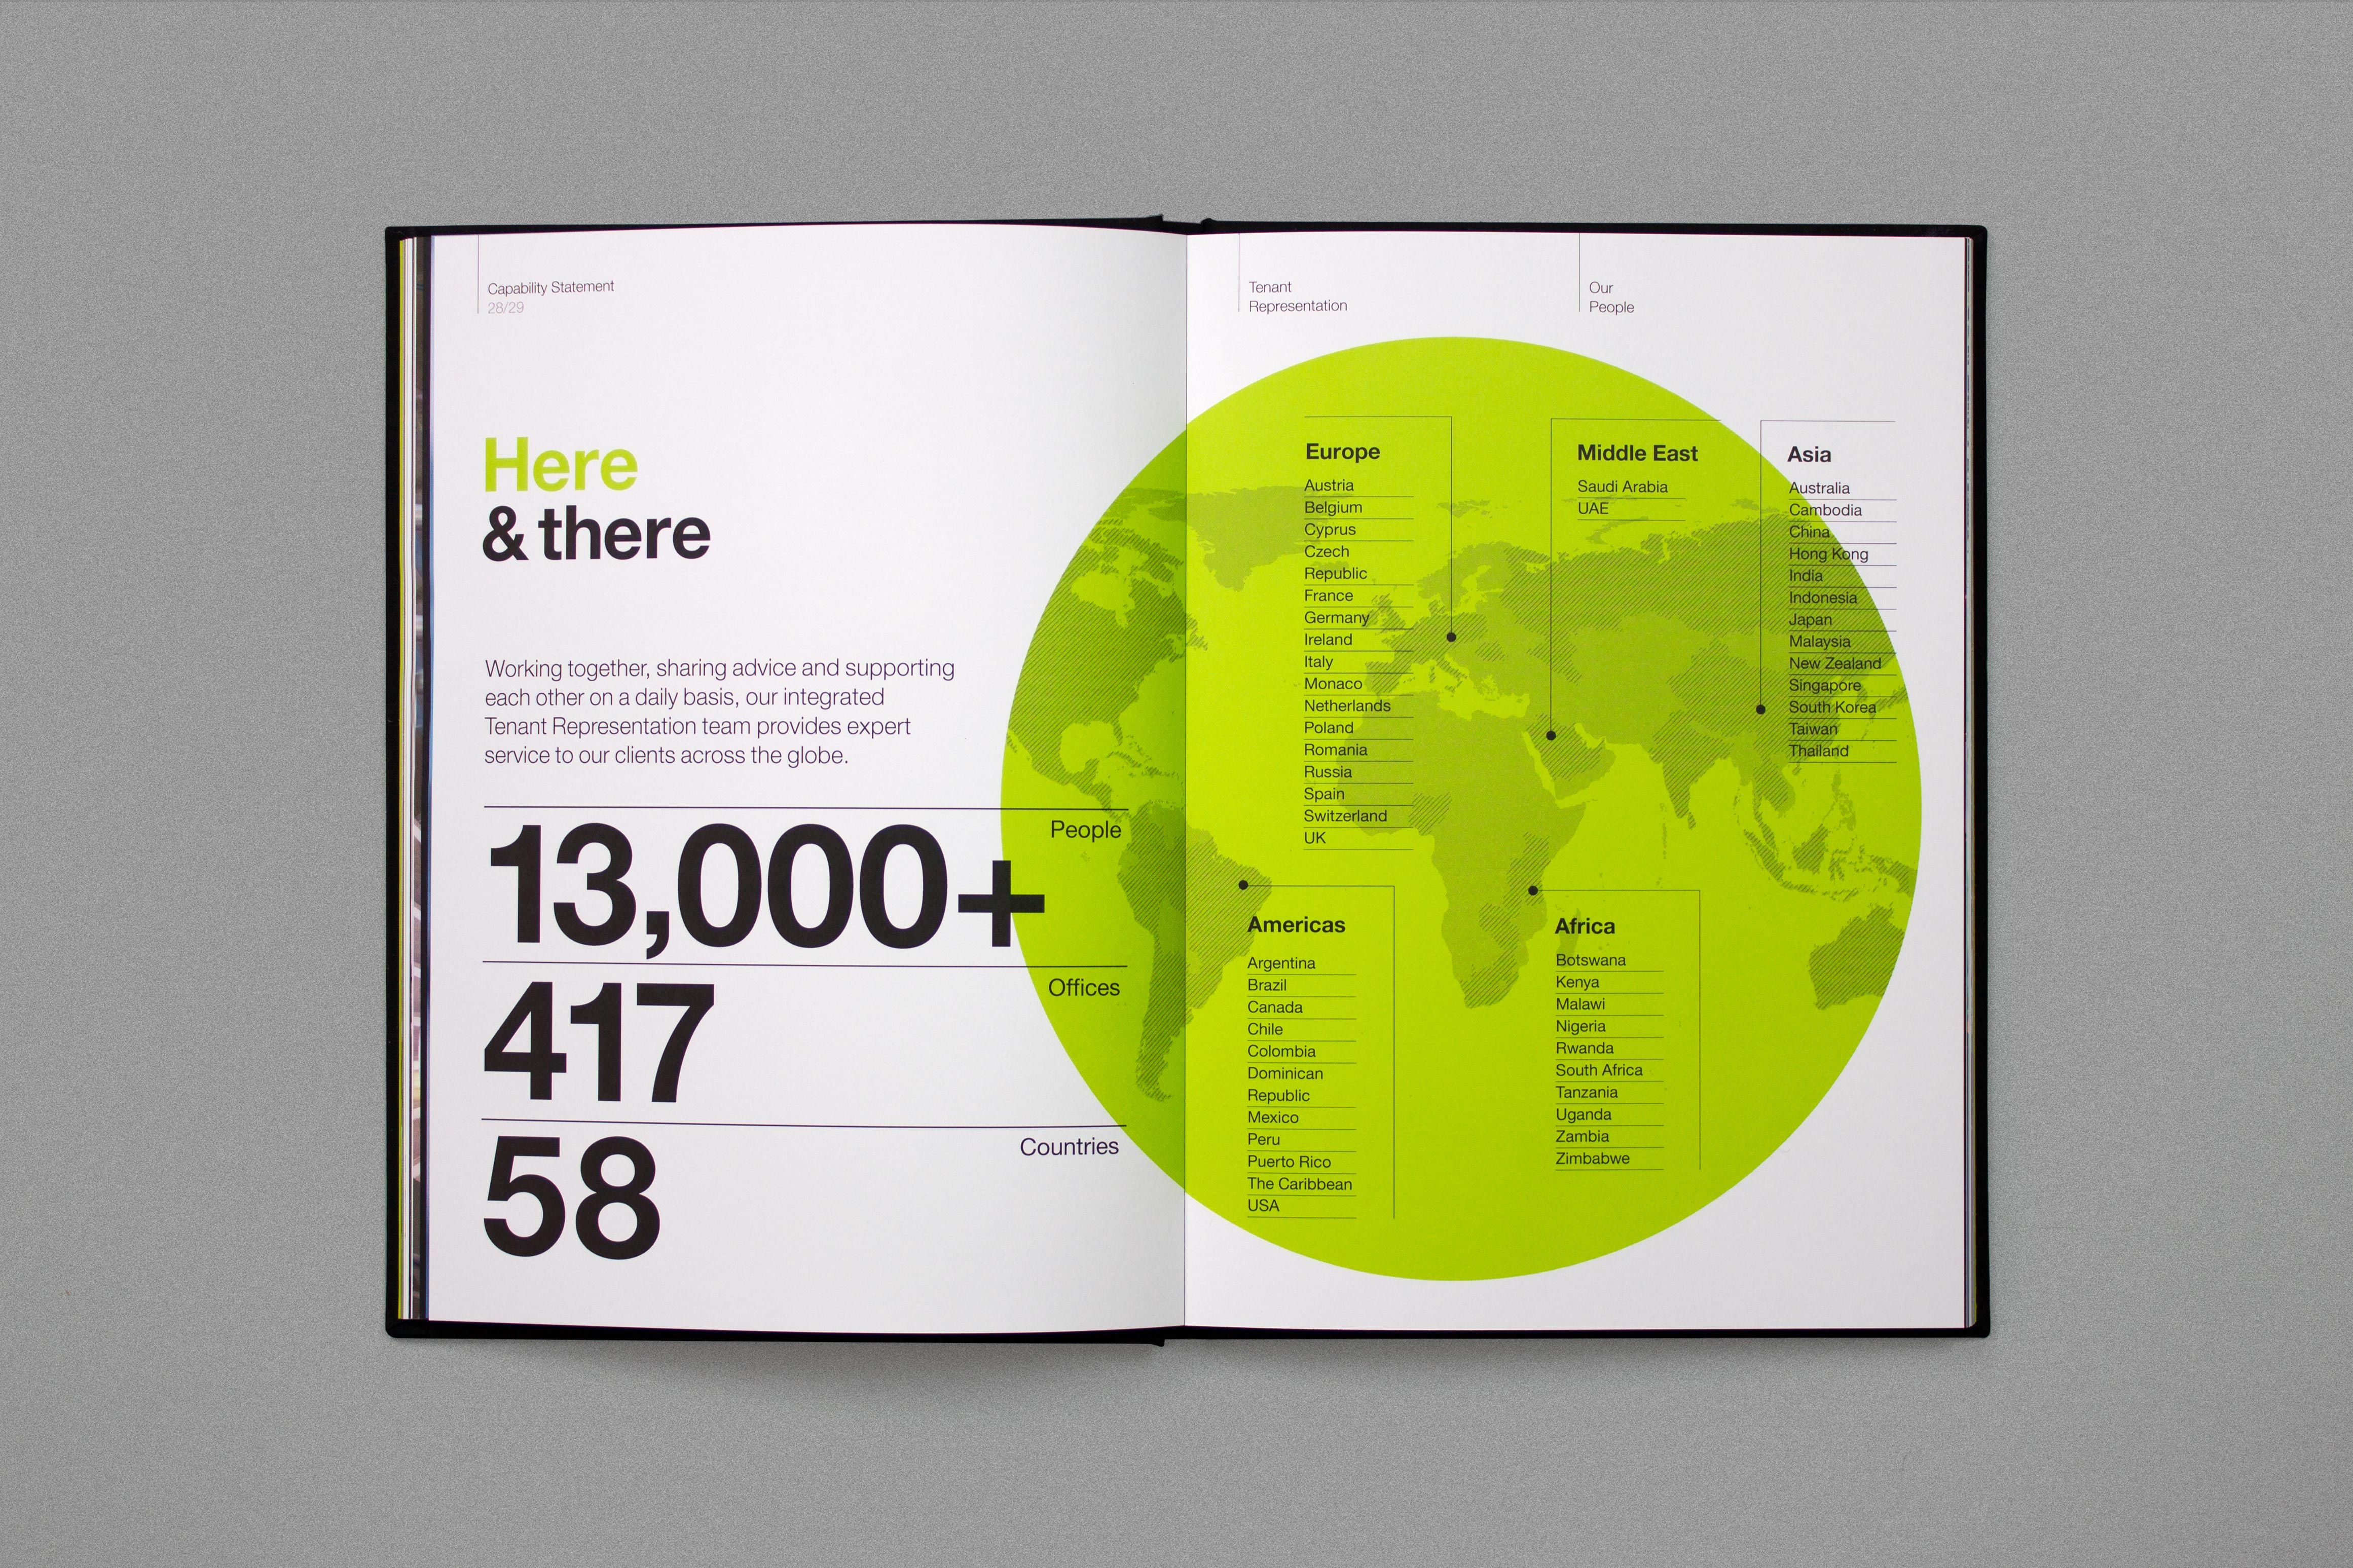
This design utilizes a clean, professional layout to present quantitative data regarding global reach. The visual language is modern and corporate, relying on clear typography and a prominent, color-coded world map to effectively communicate scale and scope.
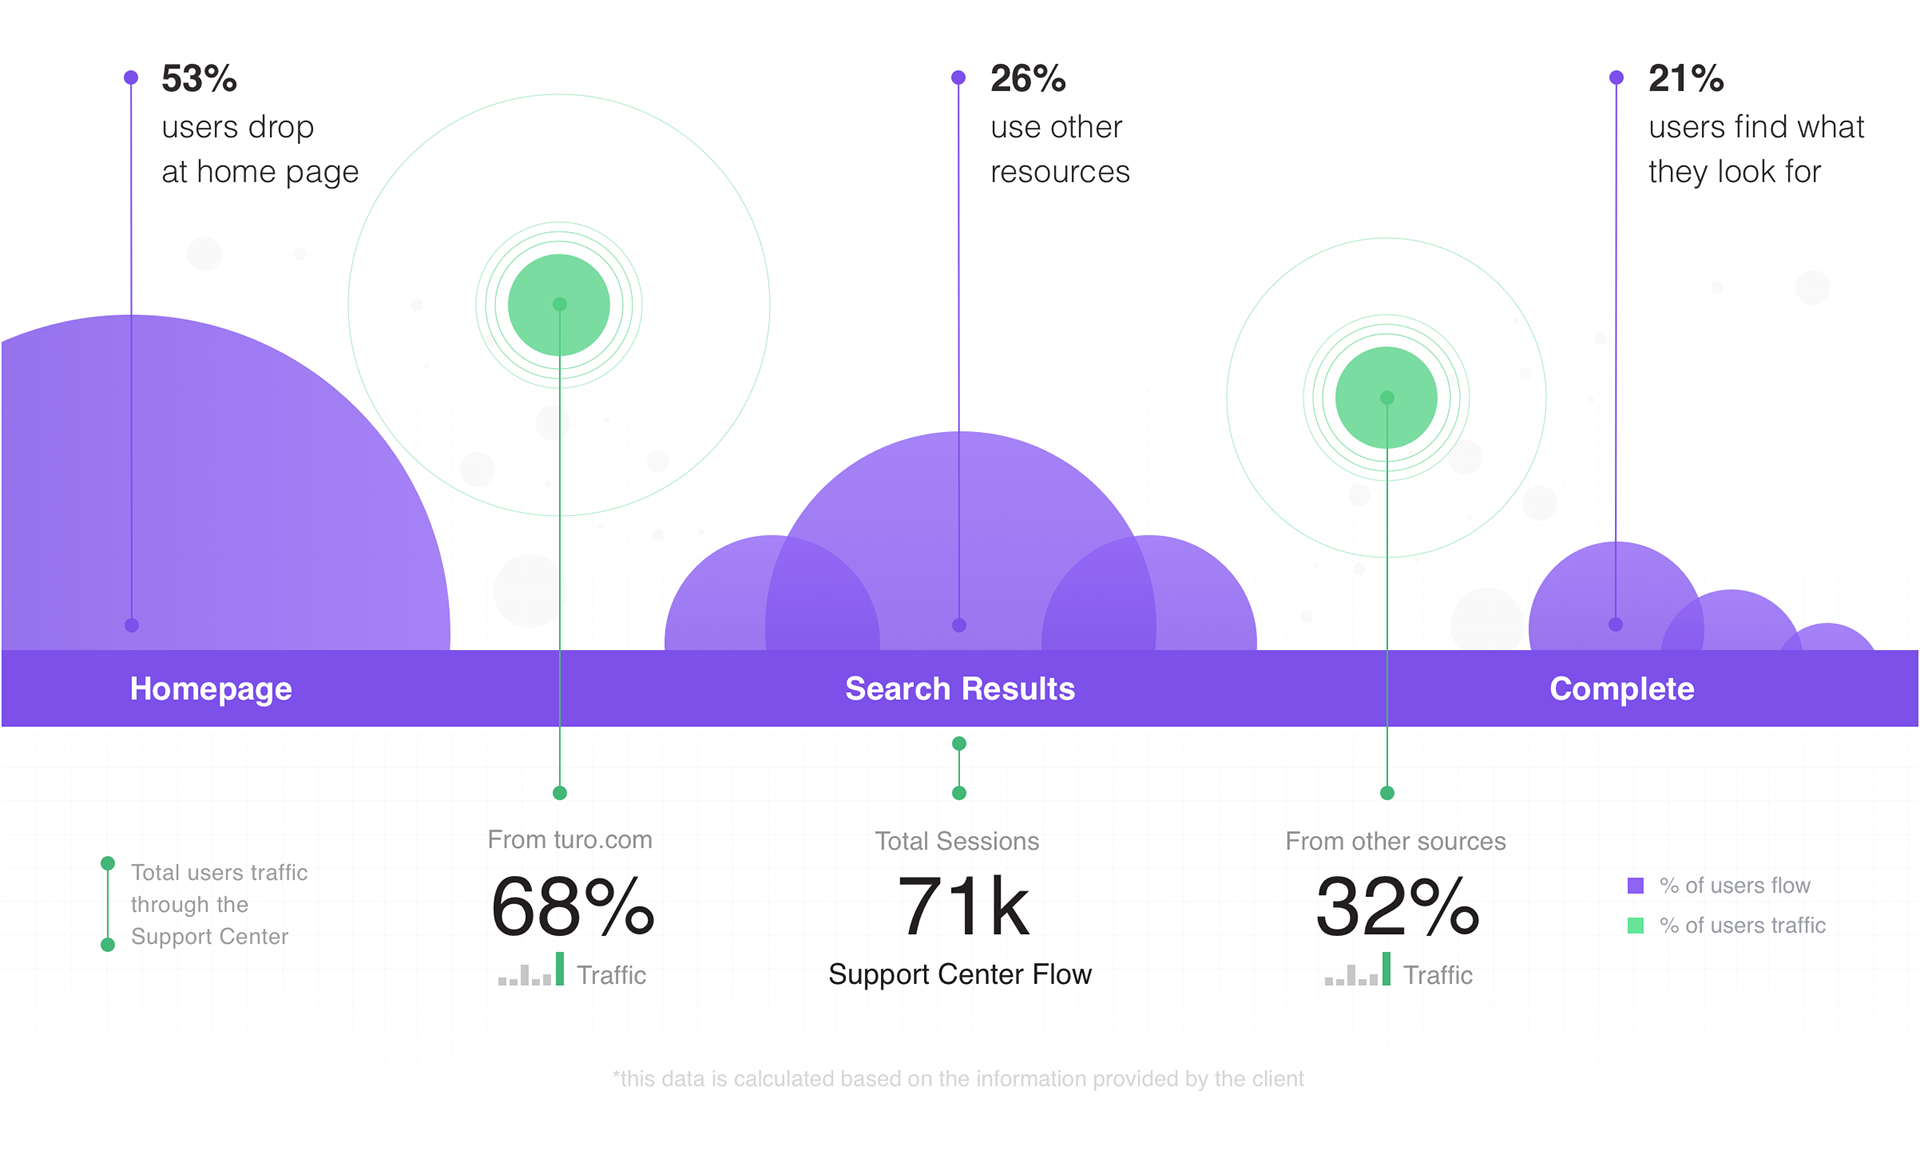
This infographic uses a clean, segmented horizontal layout to visualize user flow and drop-off rates across different stages. The design relies on distinct shades of purple to segment the data, creating a clear and analytical visual narrative. The overall feel is professional, structured, and highly informative.
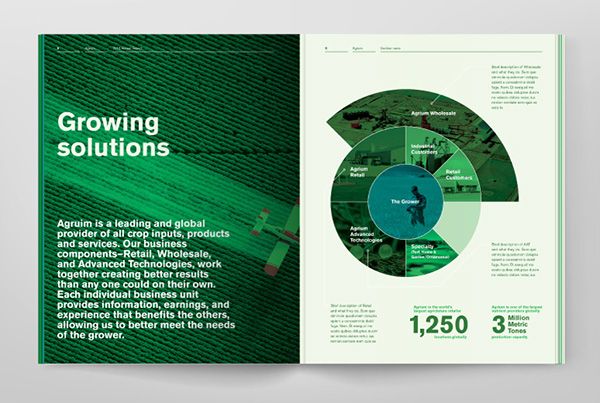
This design utilizes a clean, modern corporate aesthetic with a strong emphasis on natural growth themes through its color choices. The layout effectively balances substantial body text with clear, data-driven infographics to convey professionalism and expertise.
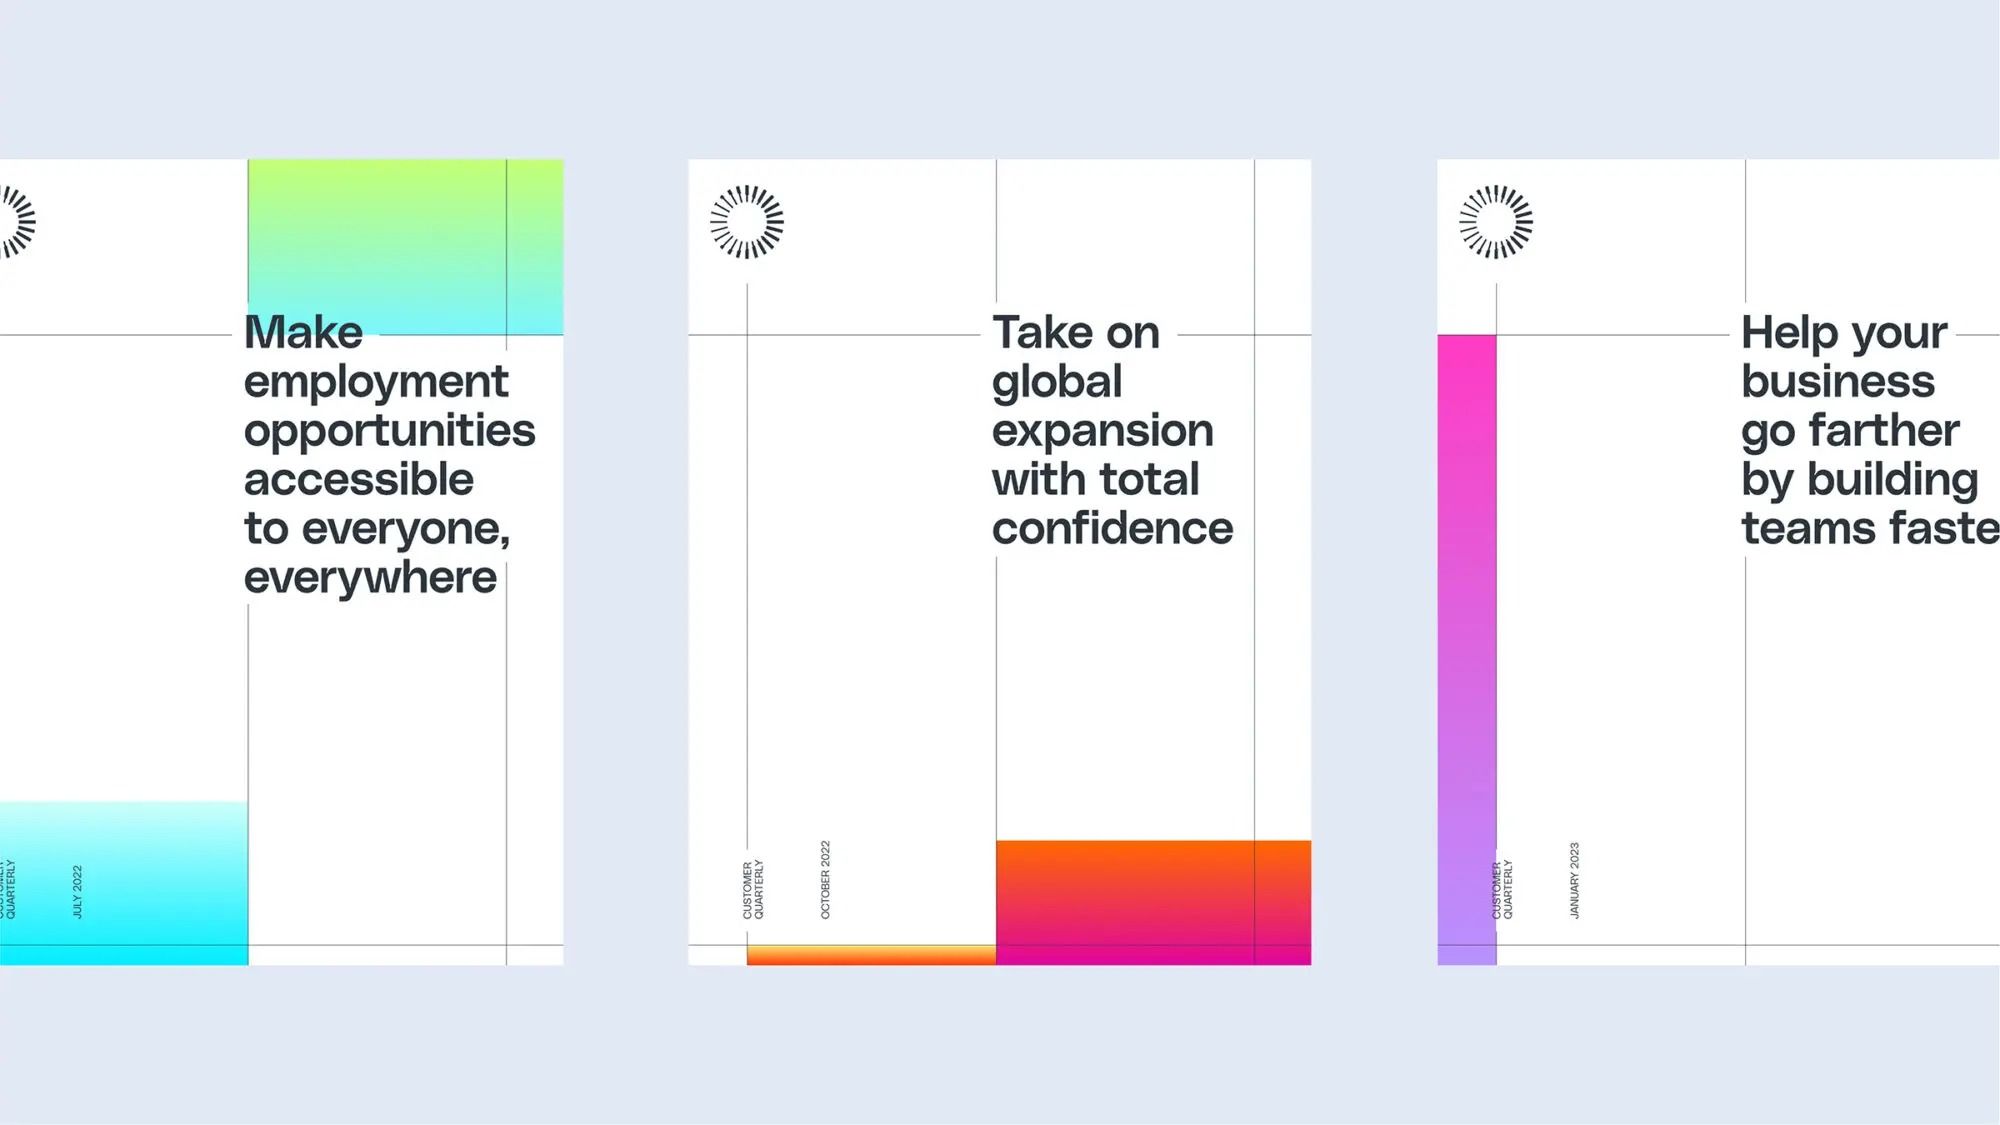
This is a clean and professional infographic design utilizing strong vertical segmentation and color blocking to present distinct concepts. The visual language is minimalist, relying on clear typography and vibrant yet controlled color accents to guide the viewer through the information.