financial ui
2 designs
Showing 2 of 2 (2 total)
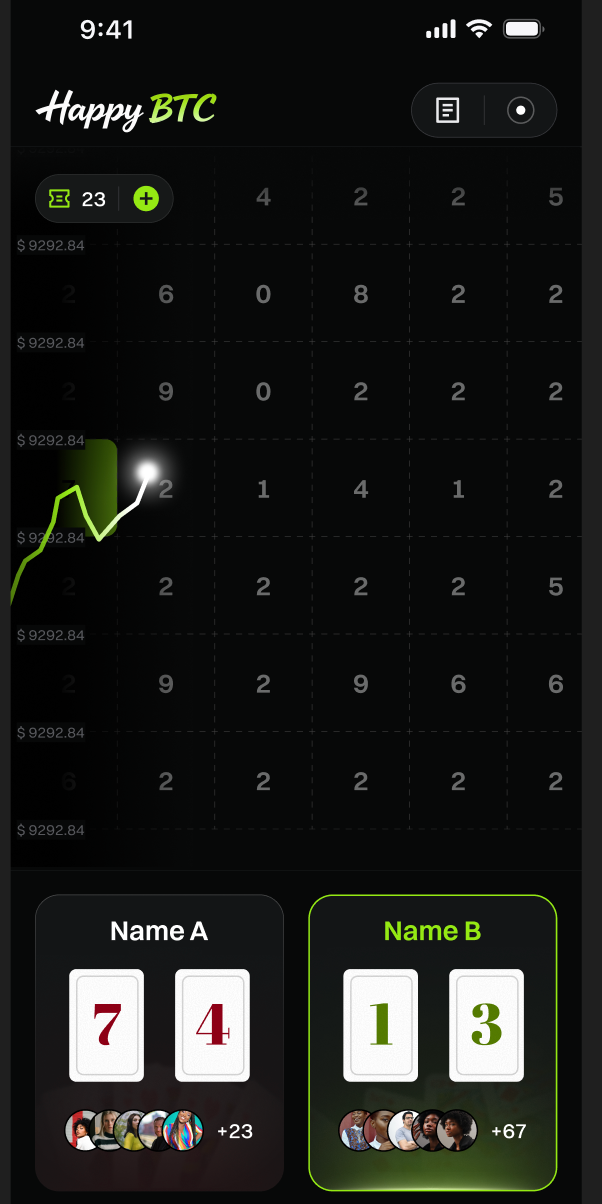
This interface features a dark mode design optimized for data visualization, presenting financial or cryptocurrency metrics in a structured grid format. The visual language is clean and functional, relying heavily on high contrast between dark backgrounds and bright accent colors to highlight key data points.
dark modedata visualizationminimalist
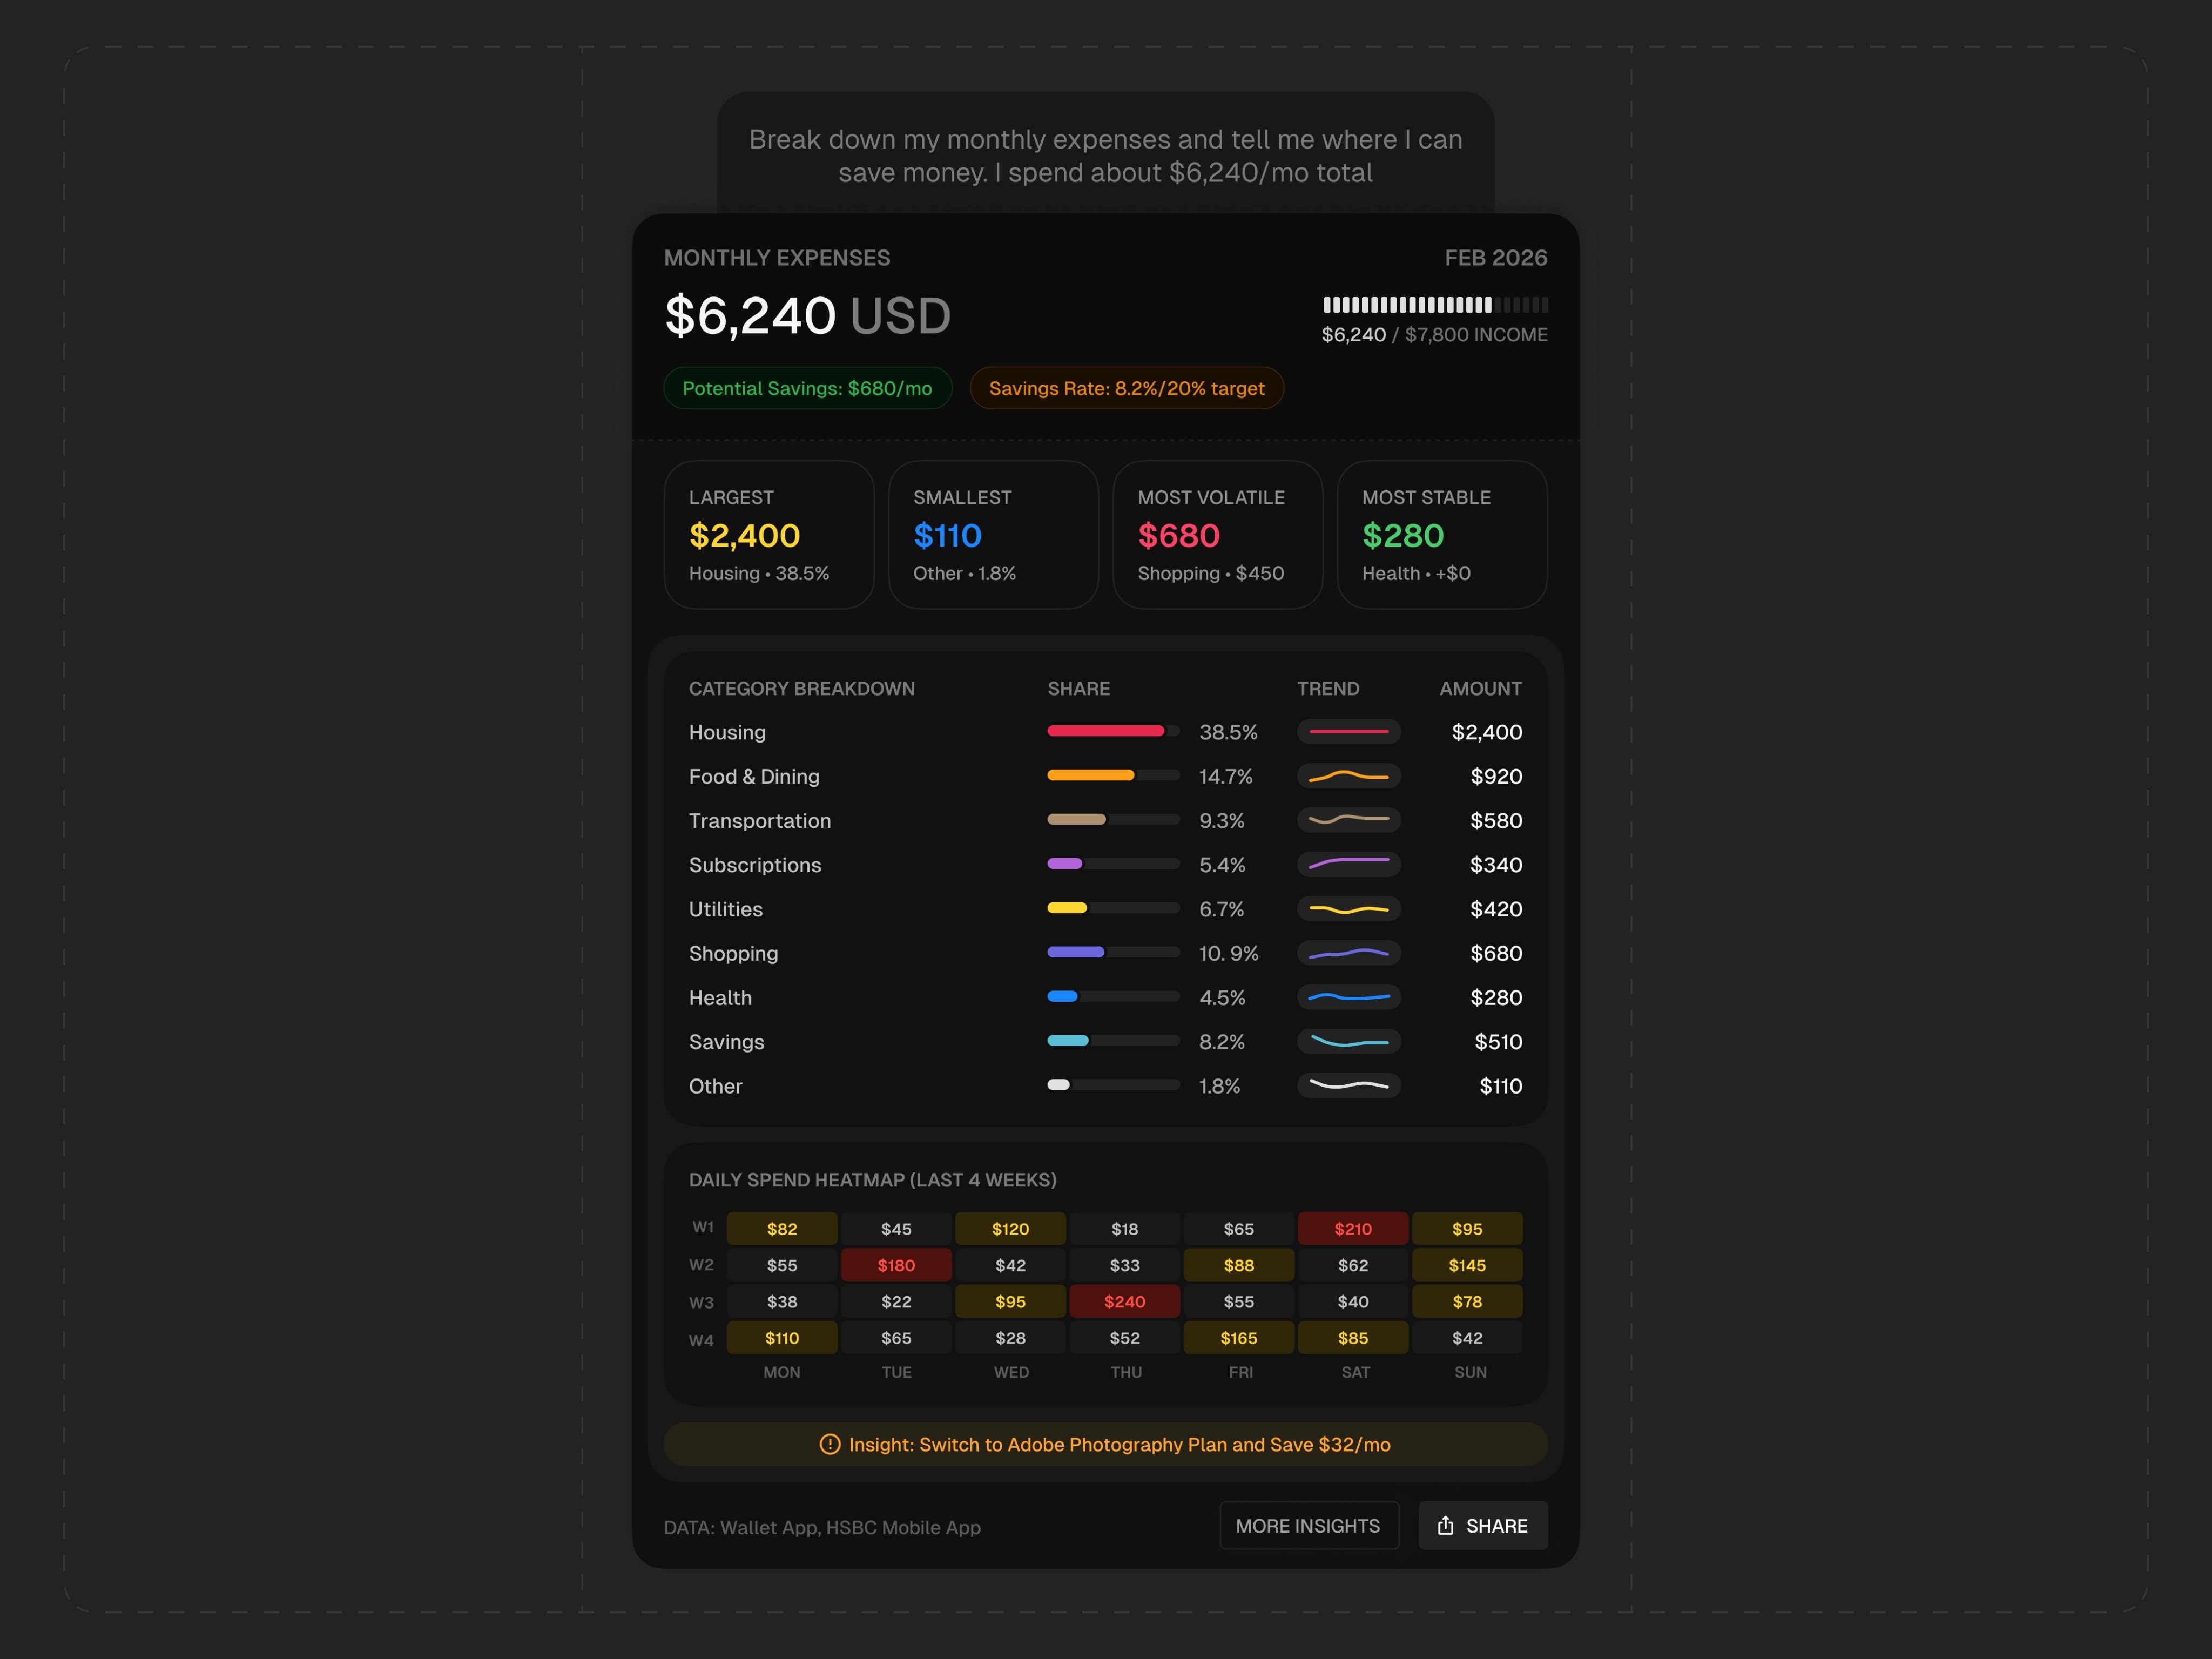
This dashboard features a clean, modern dark theme designed for complex data visualization. The visual language prioritizes clarity and organization, using segmented cards and proportional bar charts to effectively communicate financial breakdowns and savings potential.
data visualizationdashboarddark mode