1 designs
Showing 1 of 1 (1 total)
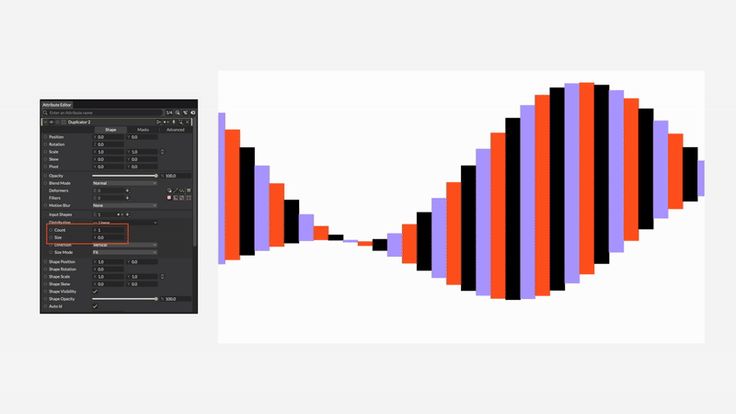
The image presents a financial or data visualization chart characterized by a dramatic, symmetrical curve rendered in vertical bars of varying colors. The design is clean and modern, focusing heavily on the visual representation of fluctuating data over time.