stock market
3 designs
Showing 3 of 3 (3 total)
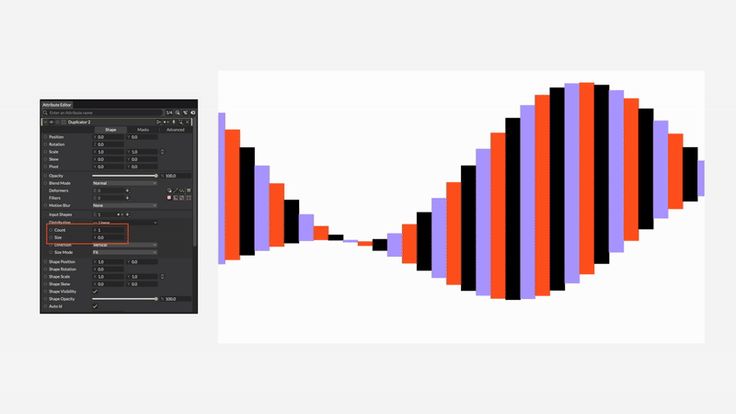
The image presents a financial or data visualization chart characterized by a dramatic, symmetrical curve rendered in vertical bars of varying colors. The design is clean and modern, focusing heavily on the visual representation of fluctuating data over time.
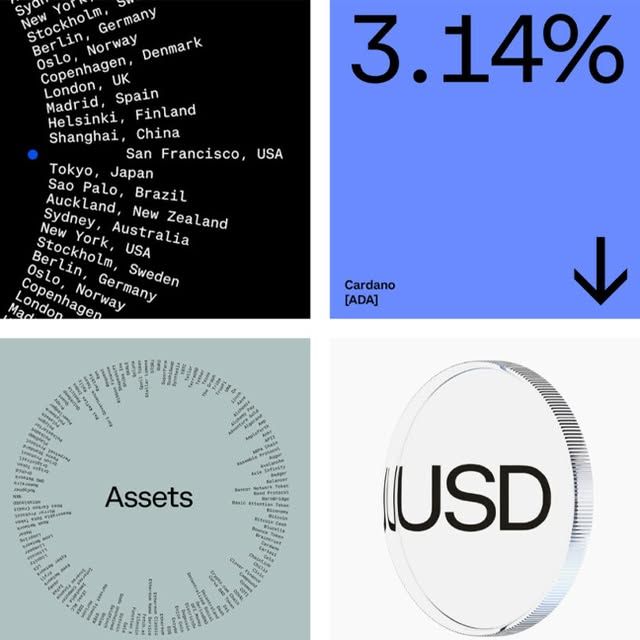
This collection of visuals employs a clean, high-contrast design language typical of financial data presentation, utilizing distinct modules to showcase metrics and assets. The visual style is modern, precise, and focused purely on conveying quantitative information.
This design utilizes a dynamic, horizontal gradient approach to display data metrics, giving it a sleek and modern feel. The visual language relies heavily on shifting color transitions to highlight various data points in a clean, high-tech manner. The composition is organized and dense, effectively conveying a large amount of information in an engaging way.