research publication
3 designs
Showing 3 of 3 (3 total)
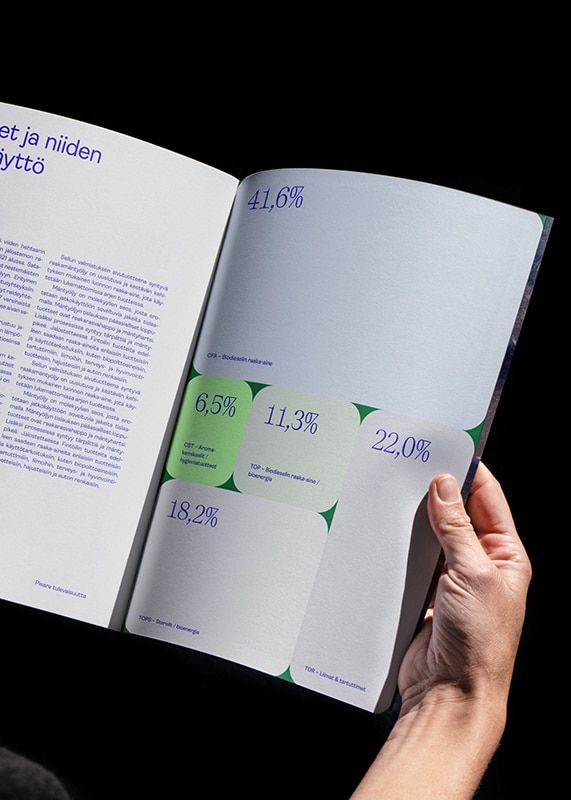
A minimalist data visualization publication featuring statistical infographics with percentage metrics displayed across an open spread. The design employs a clean, modern aesthetic with strategic use of color-coded data points and geometric shapes to communicate quantitative information. The composition balances dense text on the left with visual data representation on the right, creating an accessible editorial layout.
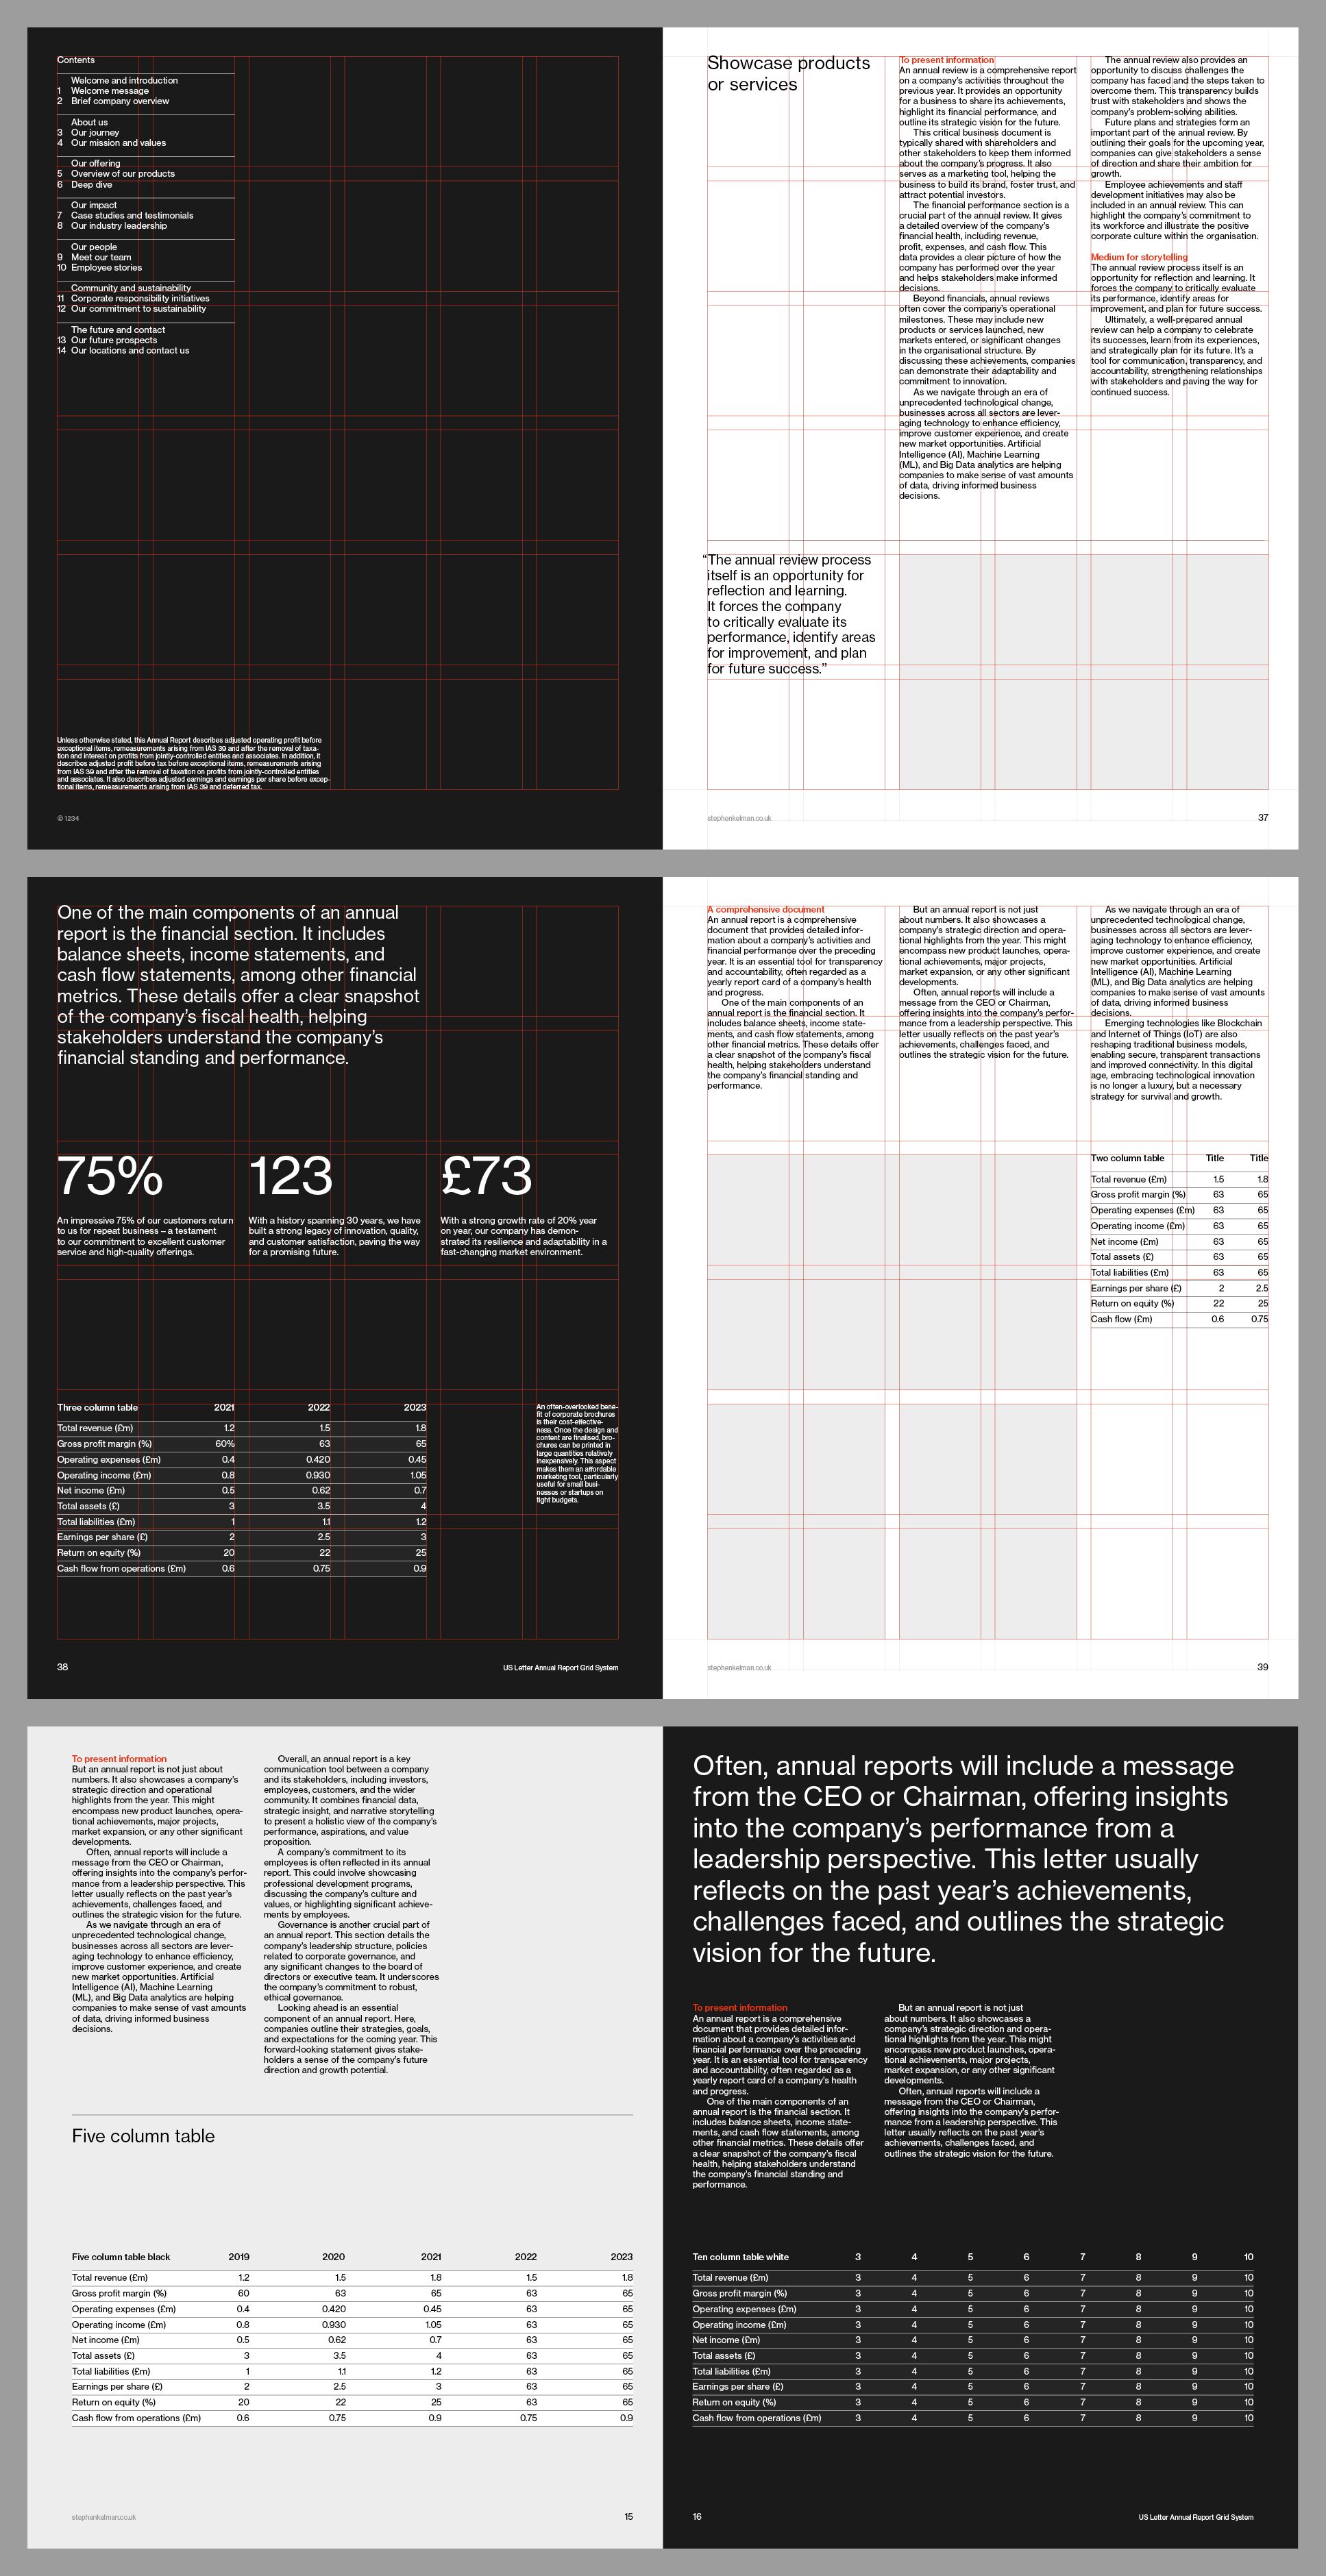
A sophisticated multi-page editorial or report layout featuring a stark black and white color scheme with minimal typography and generous whitespace. The design employs a grid-based structure with strategic use of data visualization, statistics, and text blocks arranged across alternating dark and light pages.
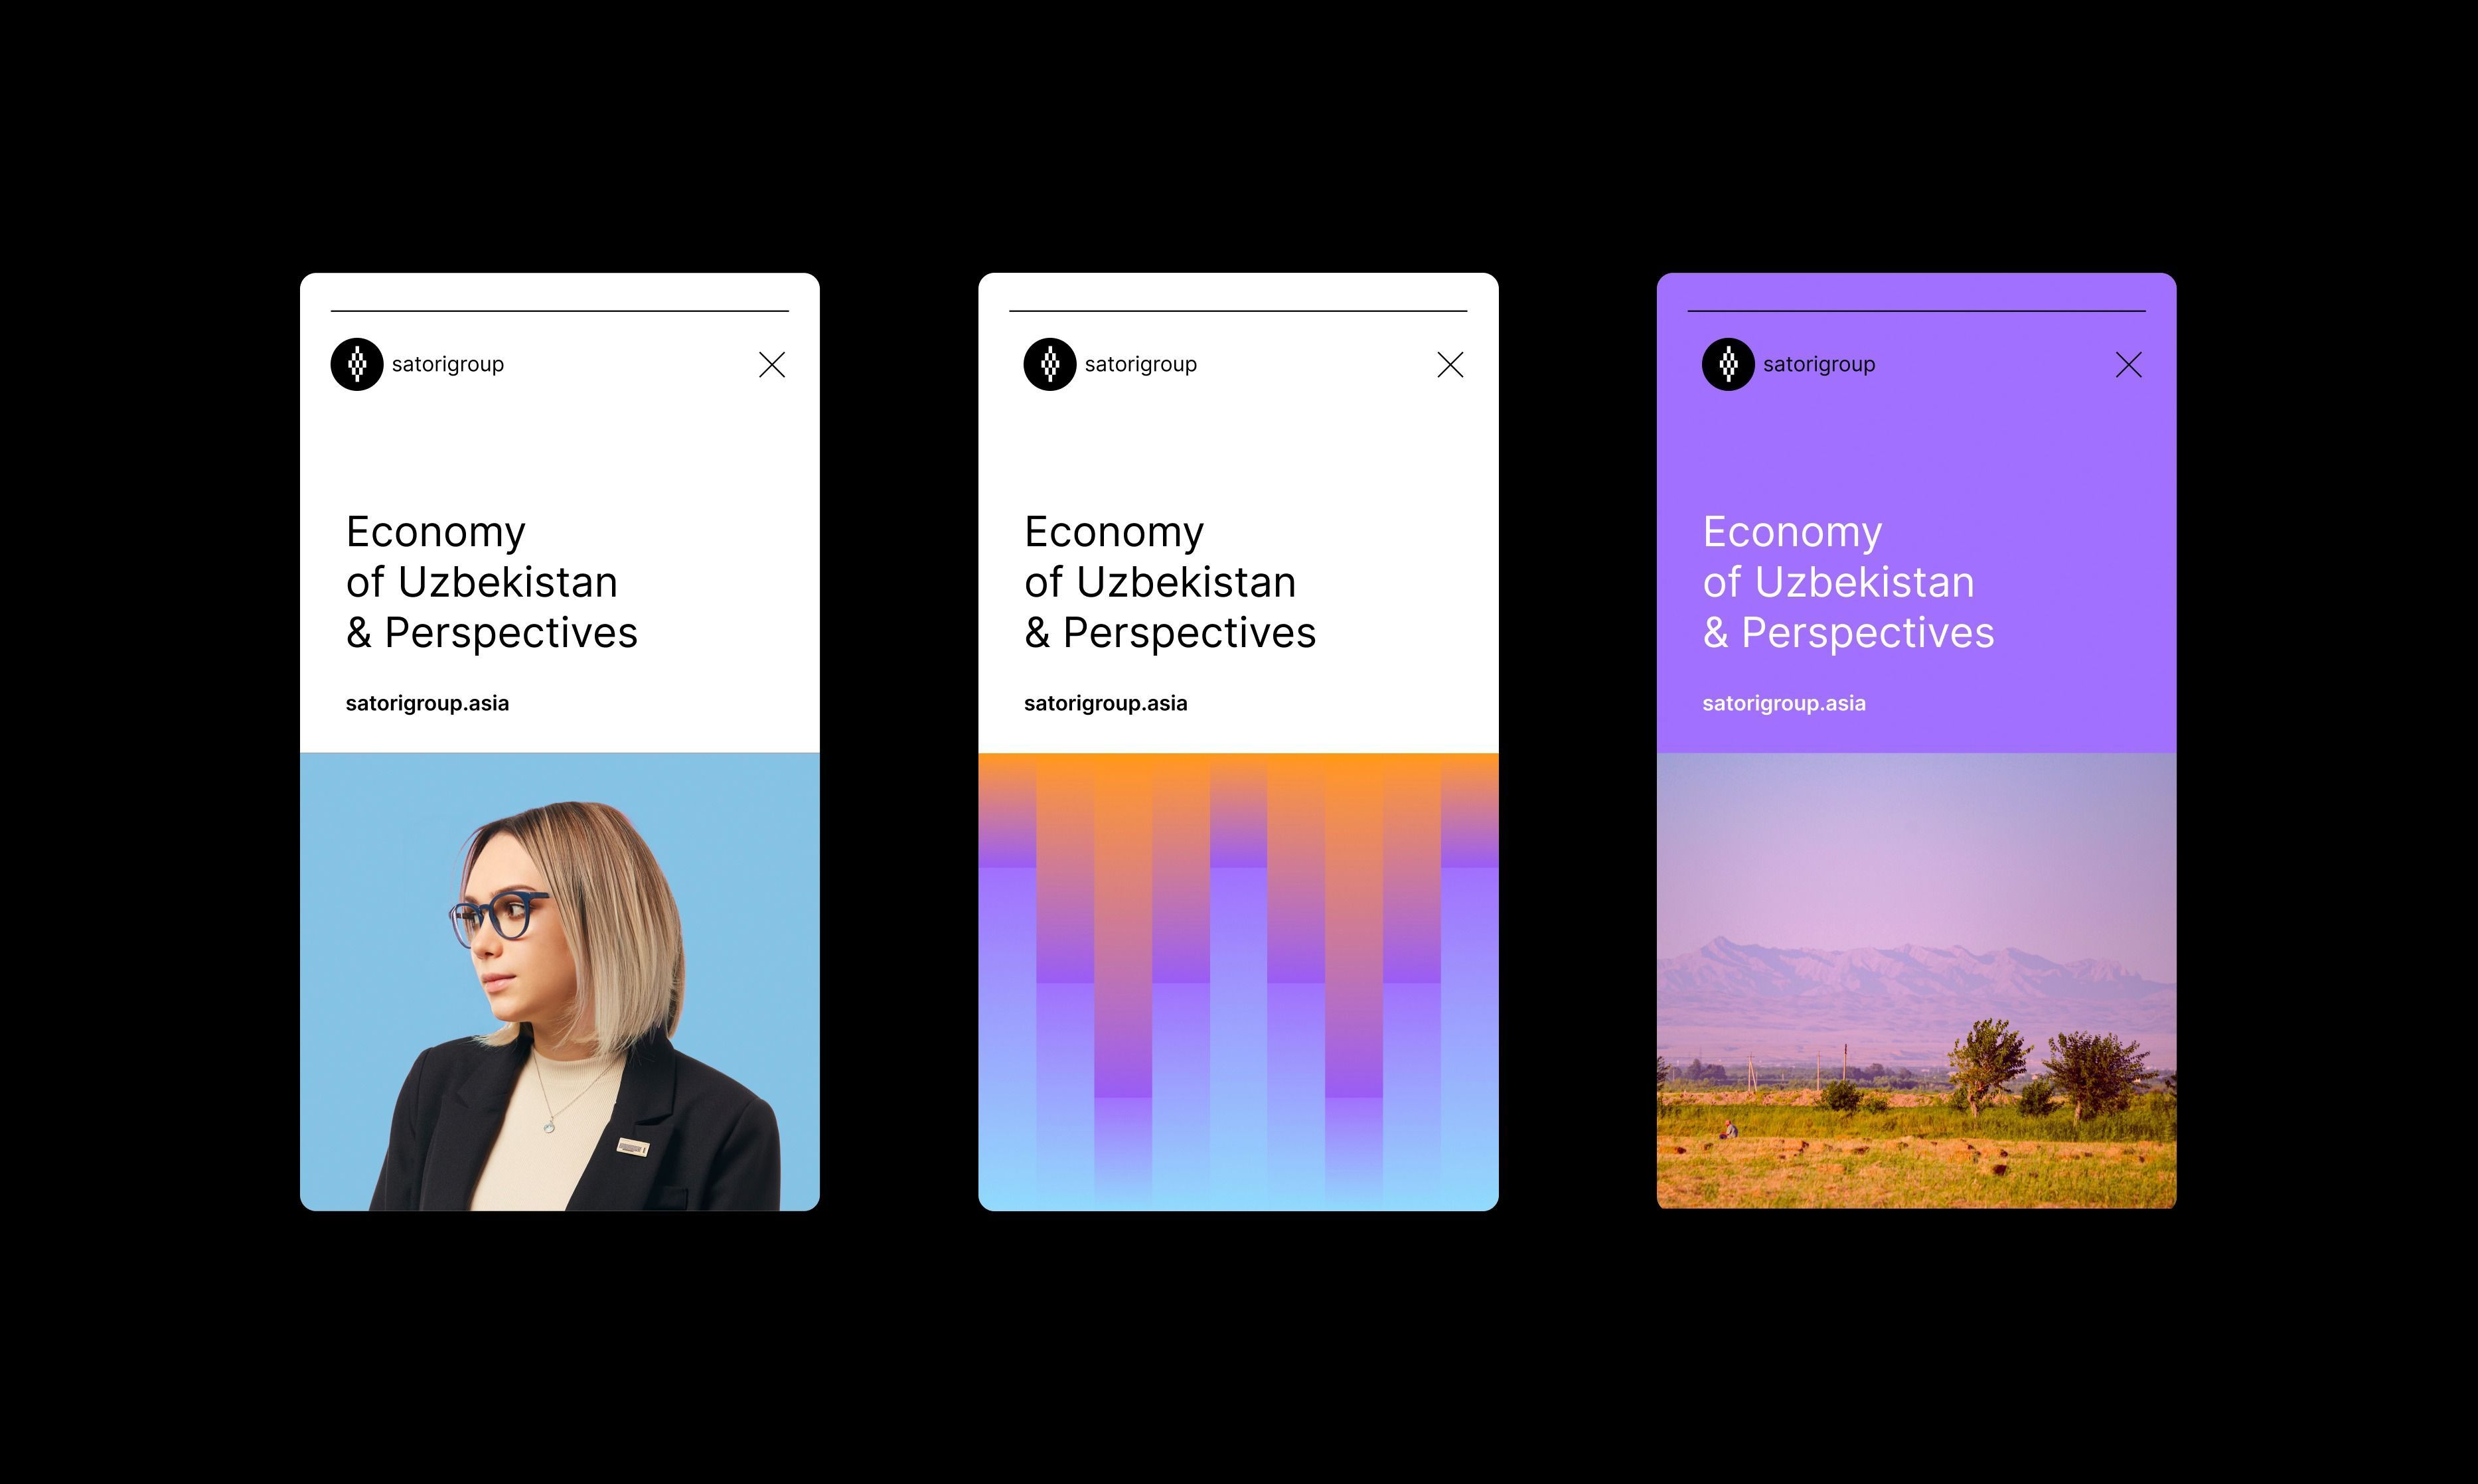
A modern digital interface showcasing three card-based layouts for an Uzbekistan economy project, featuring a clean minimalist design with progressive visual complexity. The cards demonstrate a cohesive design system with consistent typography and branding, transitioning from portrait photography to abstract gradient visualizations to landscape imagery.