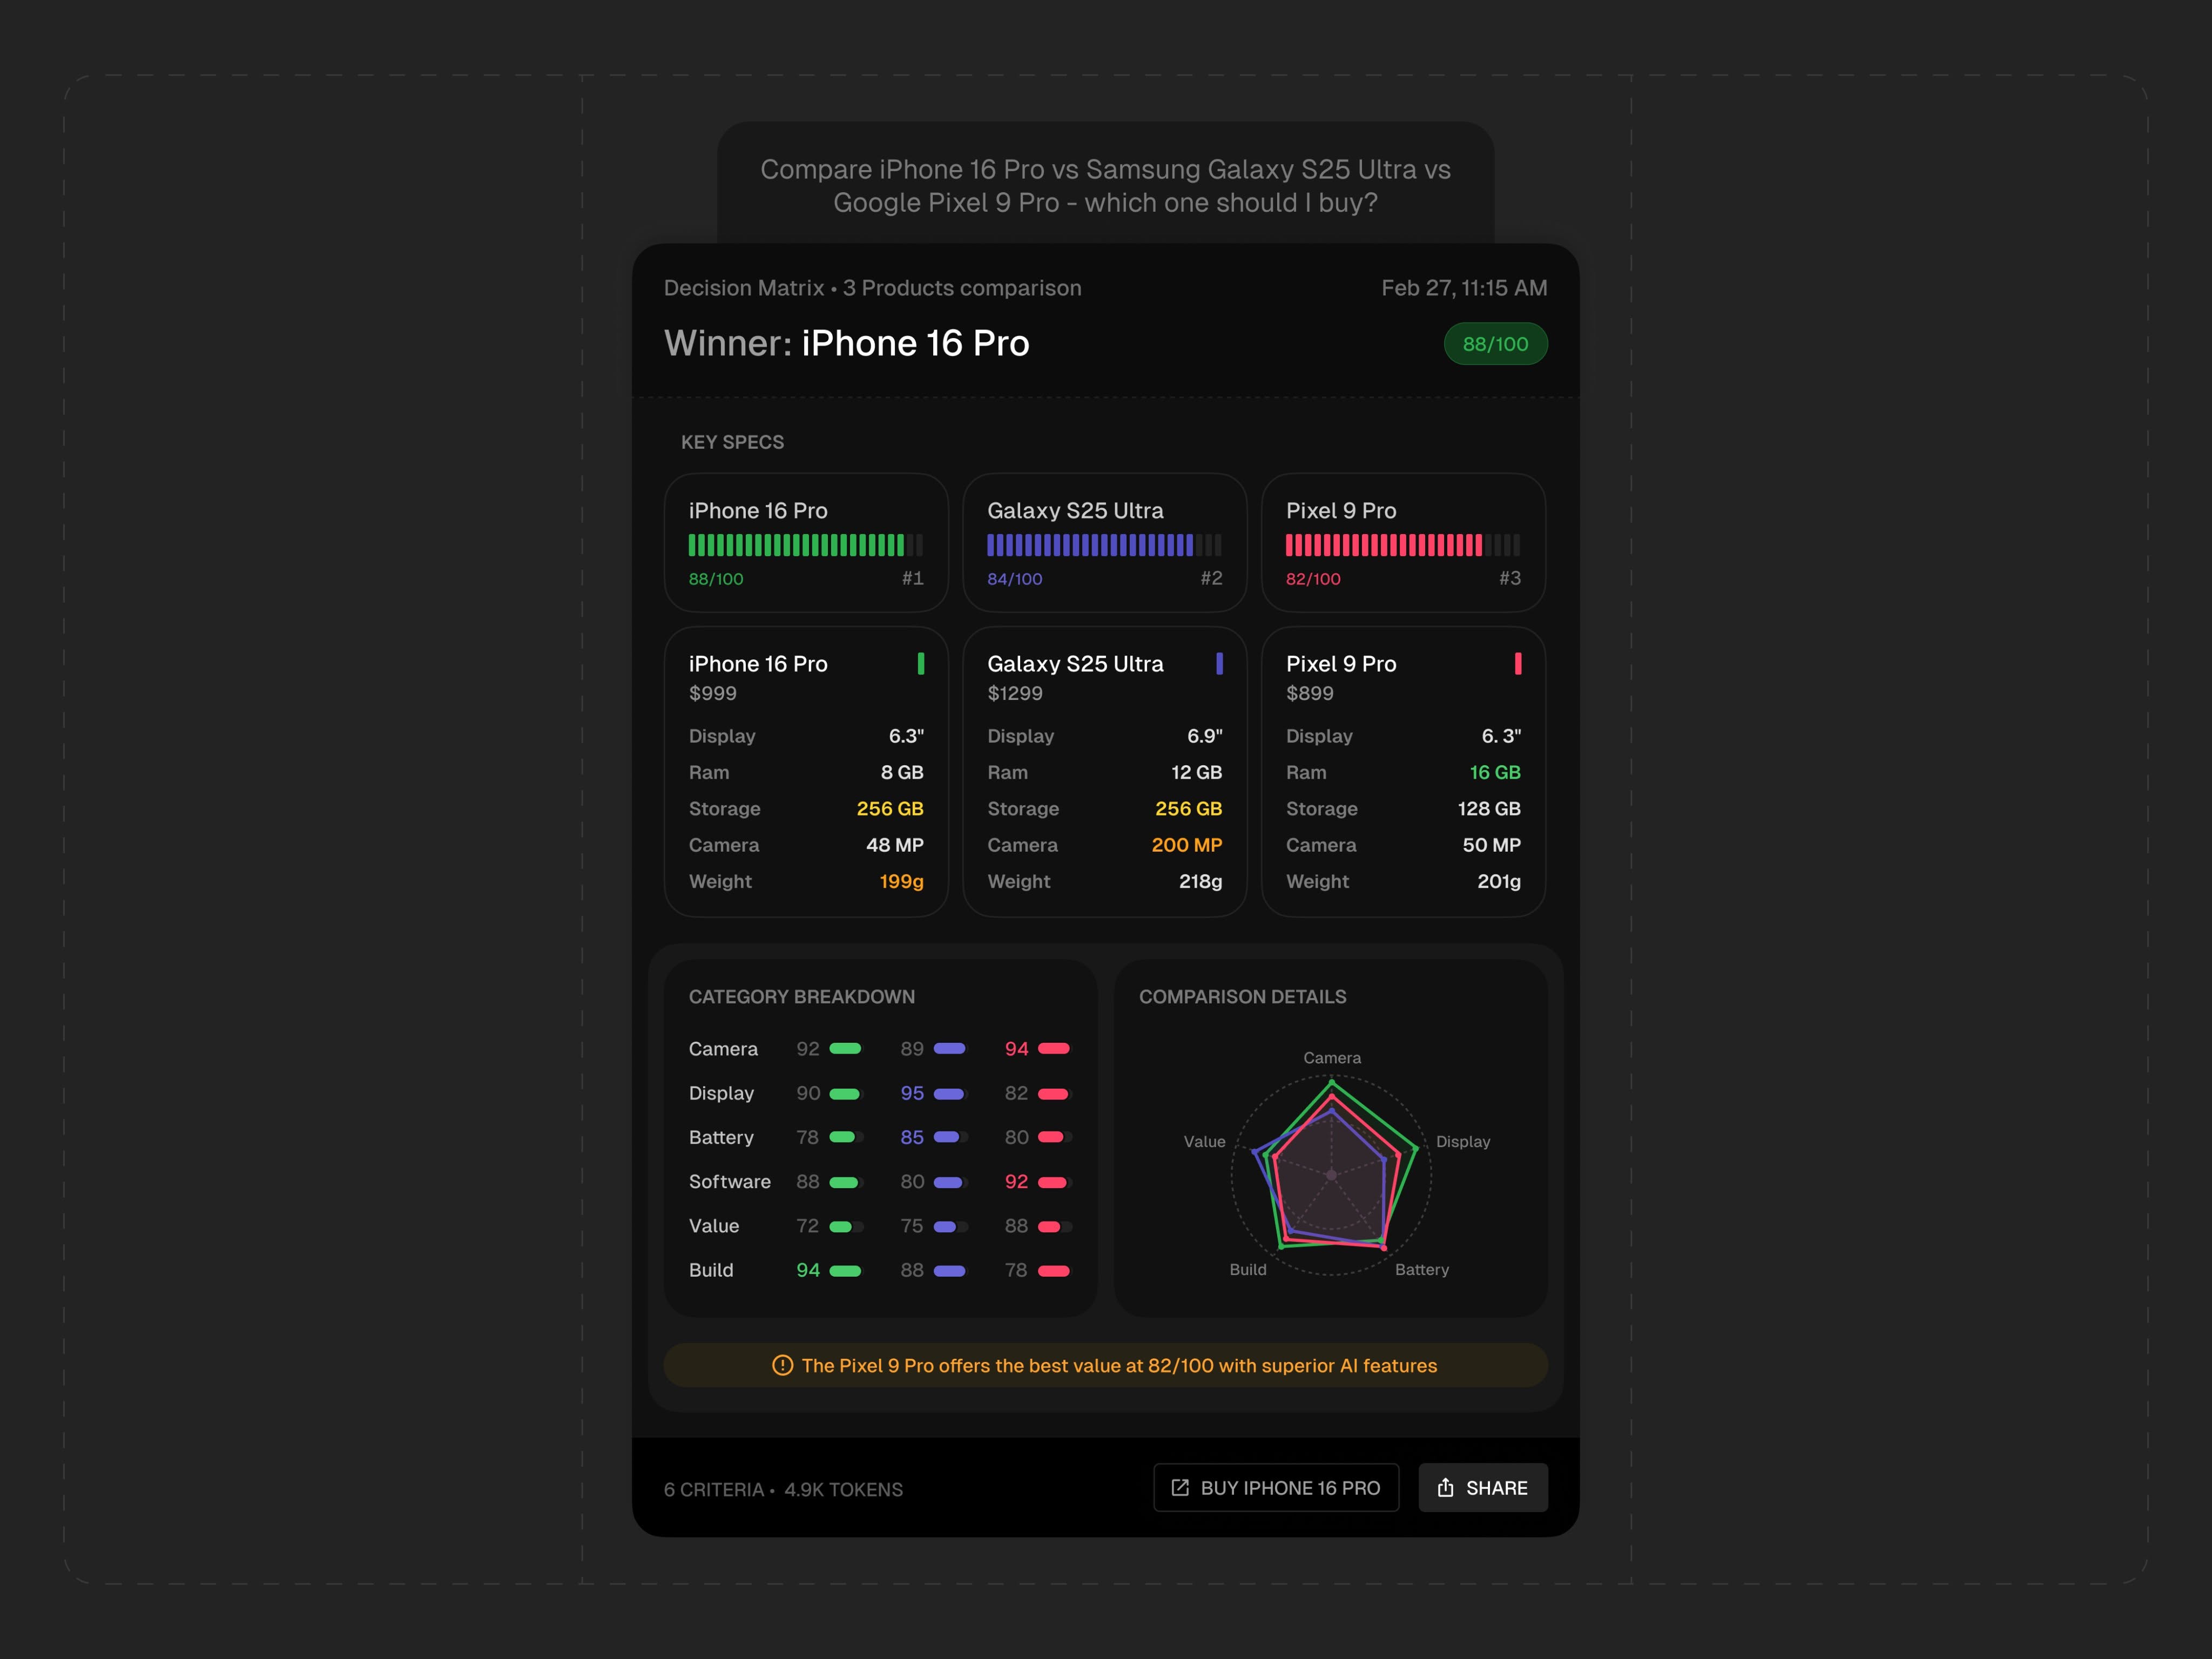
This graphic employs a clean, data-driven visual language typical of modern tech comparison tools. It uses a dark background contrasted with vibrant accent colors to clearly present complex feature data in an organized, structured matrix. The overall feel is precise, analytical, and highly informative.
data visualizationinfographicdark mode