1 designs
Showing 1 of 1 (1 total)
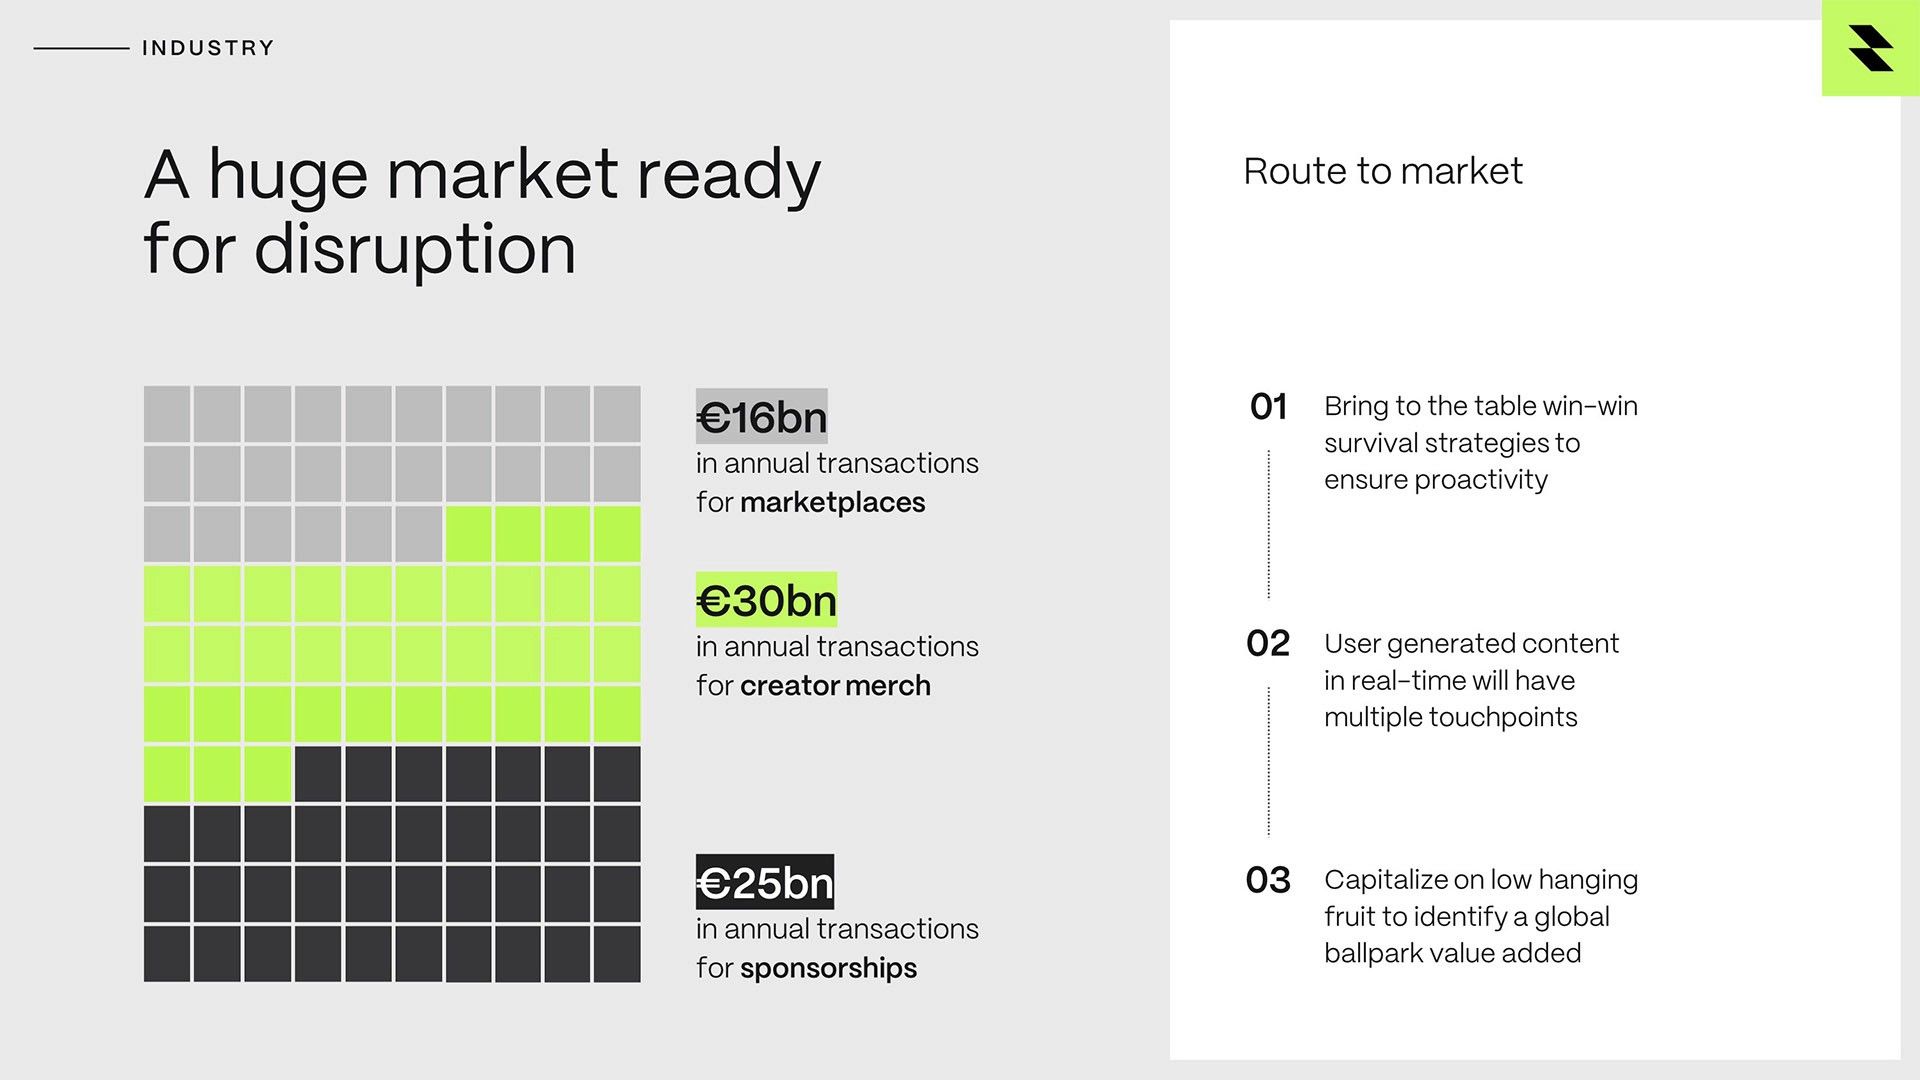
The image presents a data-driven, infographic-style visualization using a grid to represent market size segments. The design is clean and uses color blocking effectively to differentiate between different revenue streams, conveying a sense of quantitative analysis.