information design
11 designs
Showing 11 of 11 (11 total)
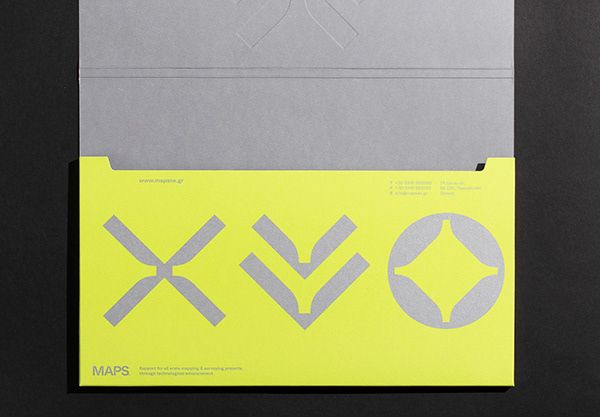
This design presents a clean, minimalist, and modern aesthetic using a high-contrast palette of light gray and vibrant yellow. The visual language relies on simple, geometric icons to convey information clearly and efficiently.
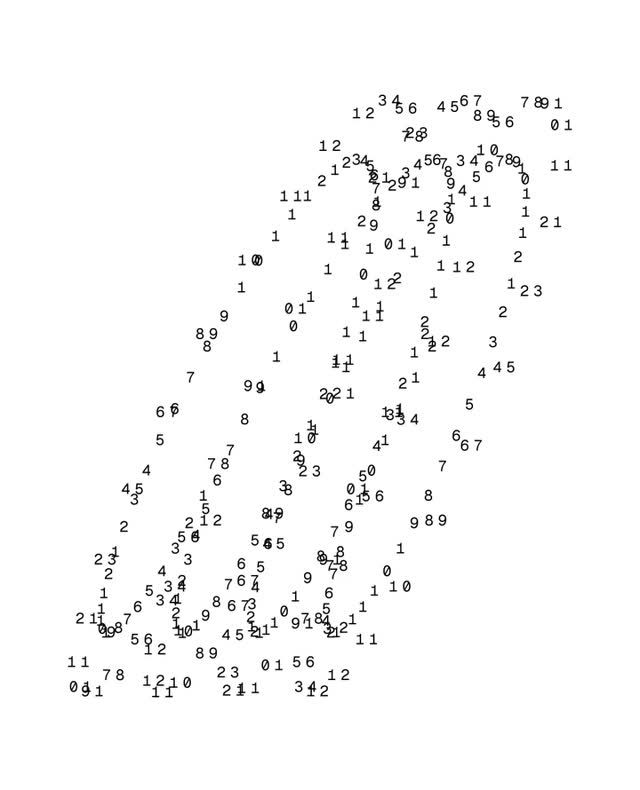
An abstract, data-driven composition featuring scattered numbers and digits of varying sizes distributed across a white background. The design creates a sense of organized chaos through mathematical or algorithmic arrangement, evoking computational thinking and information visualization.
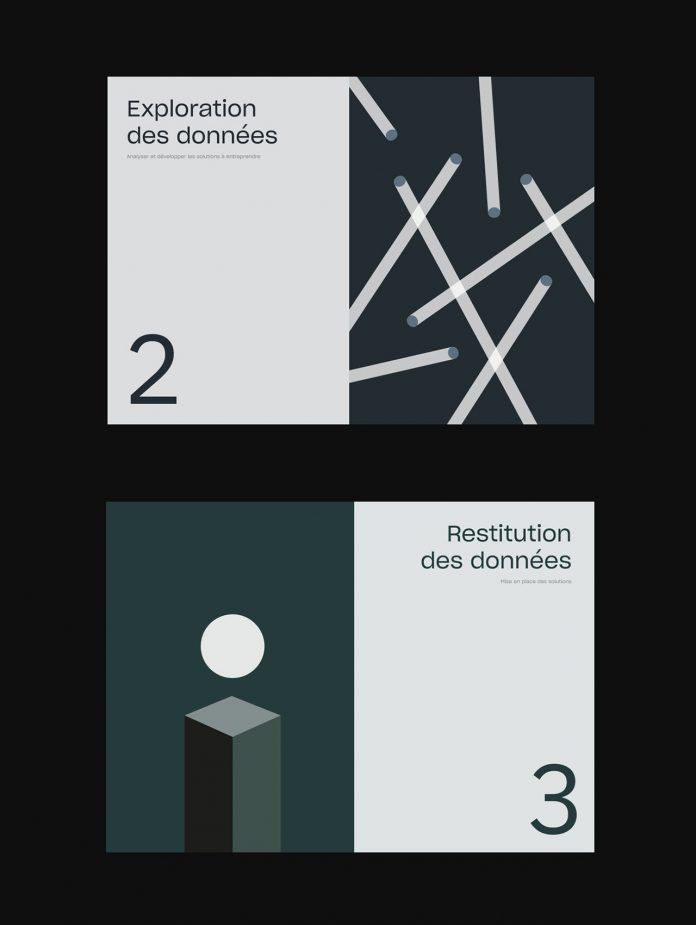
A sophisticated, minimalist design system featuring two numbered sections with contrasting visual treatments. The layout employs clean typography, geometric abstraction, and a restrained color palette to communicate data-driven concepts with contemporary elegance.
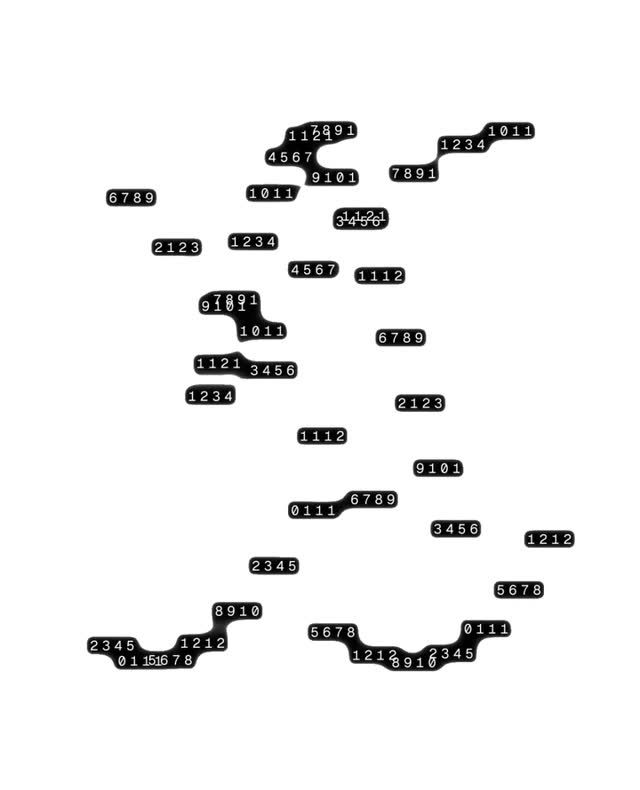
A minimalist, data-driven composition featuring scattered numerical sequences arranged organically across a white background. The design employs a stark black-and-white palette with a deconstructed, almost chaotic layout that suggests digital information, code, or abstract data visualization.
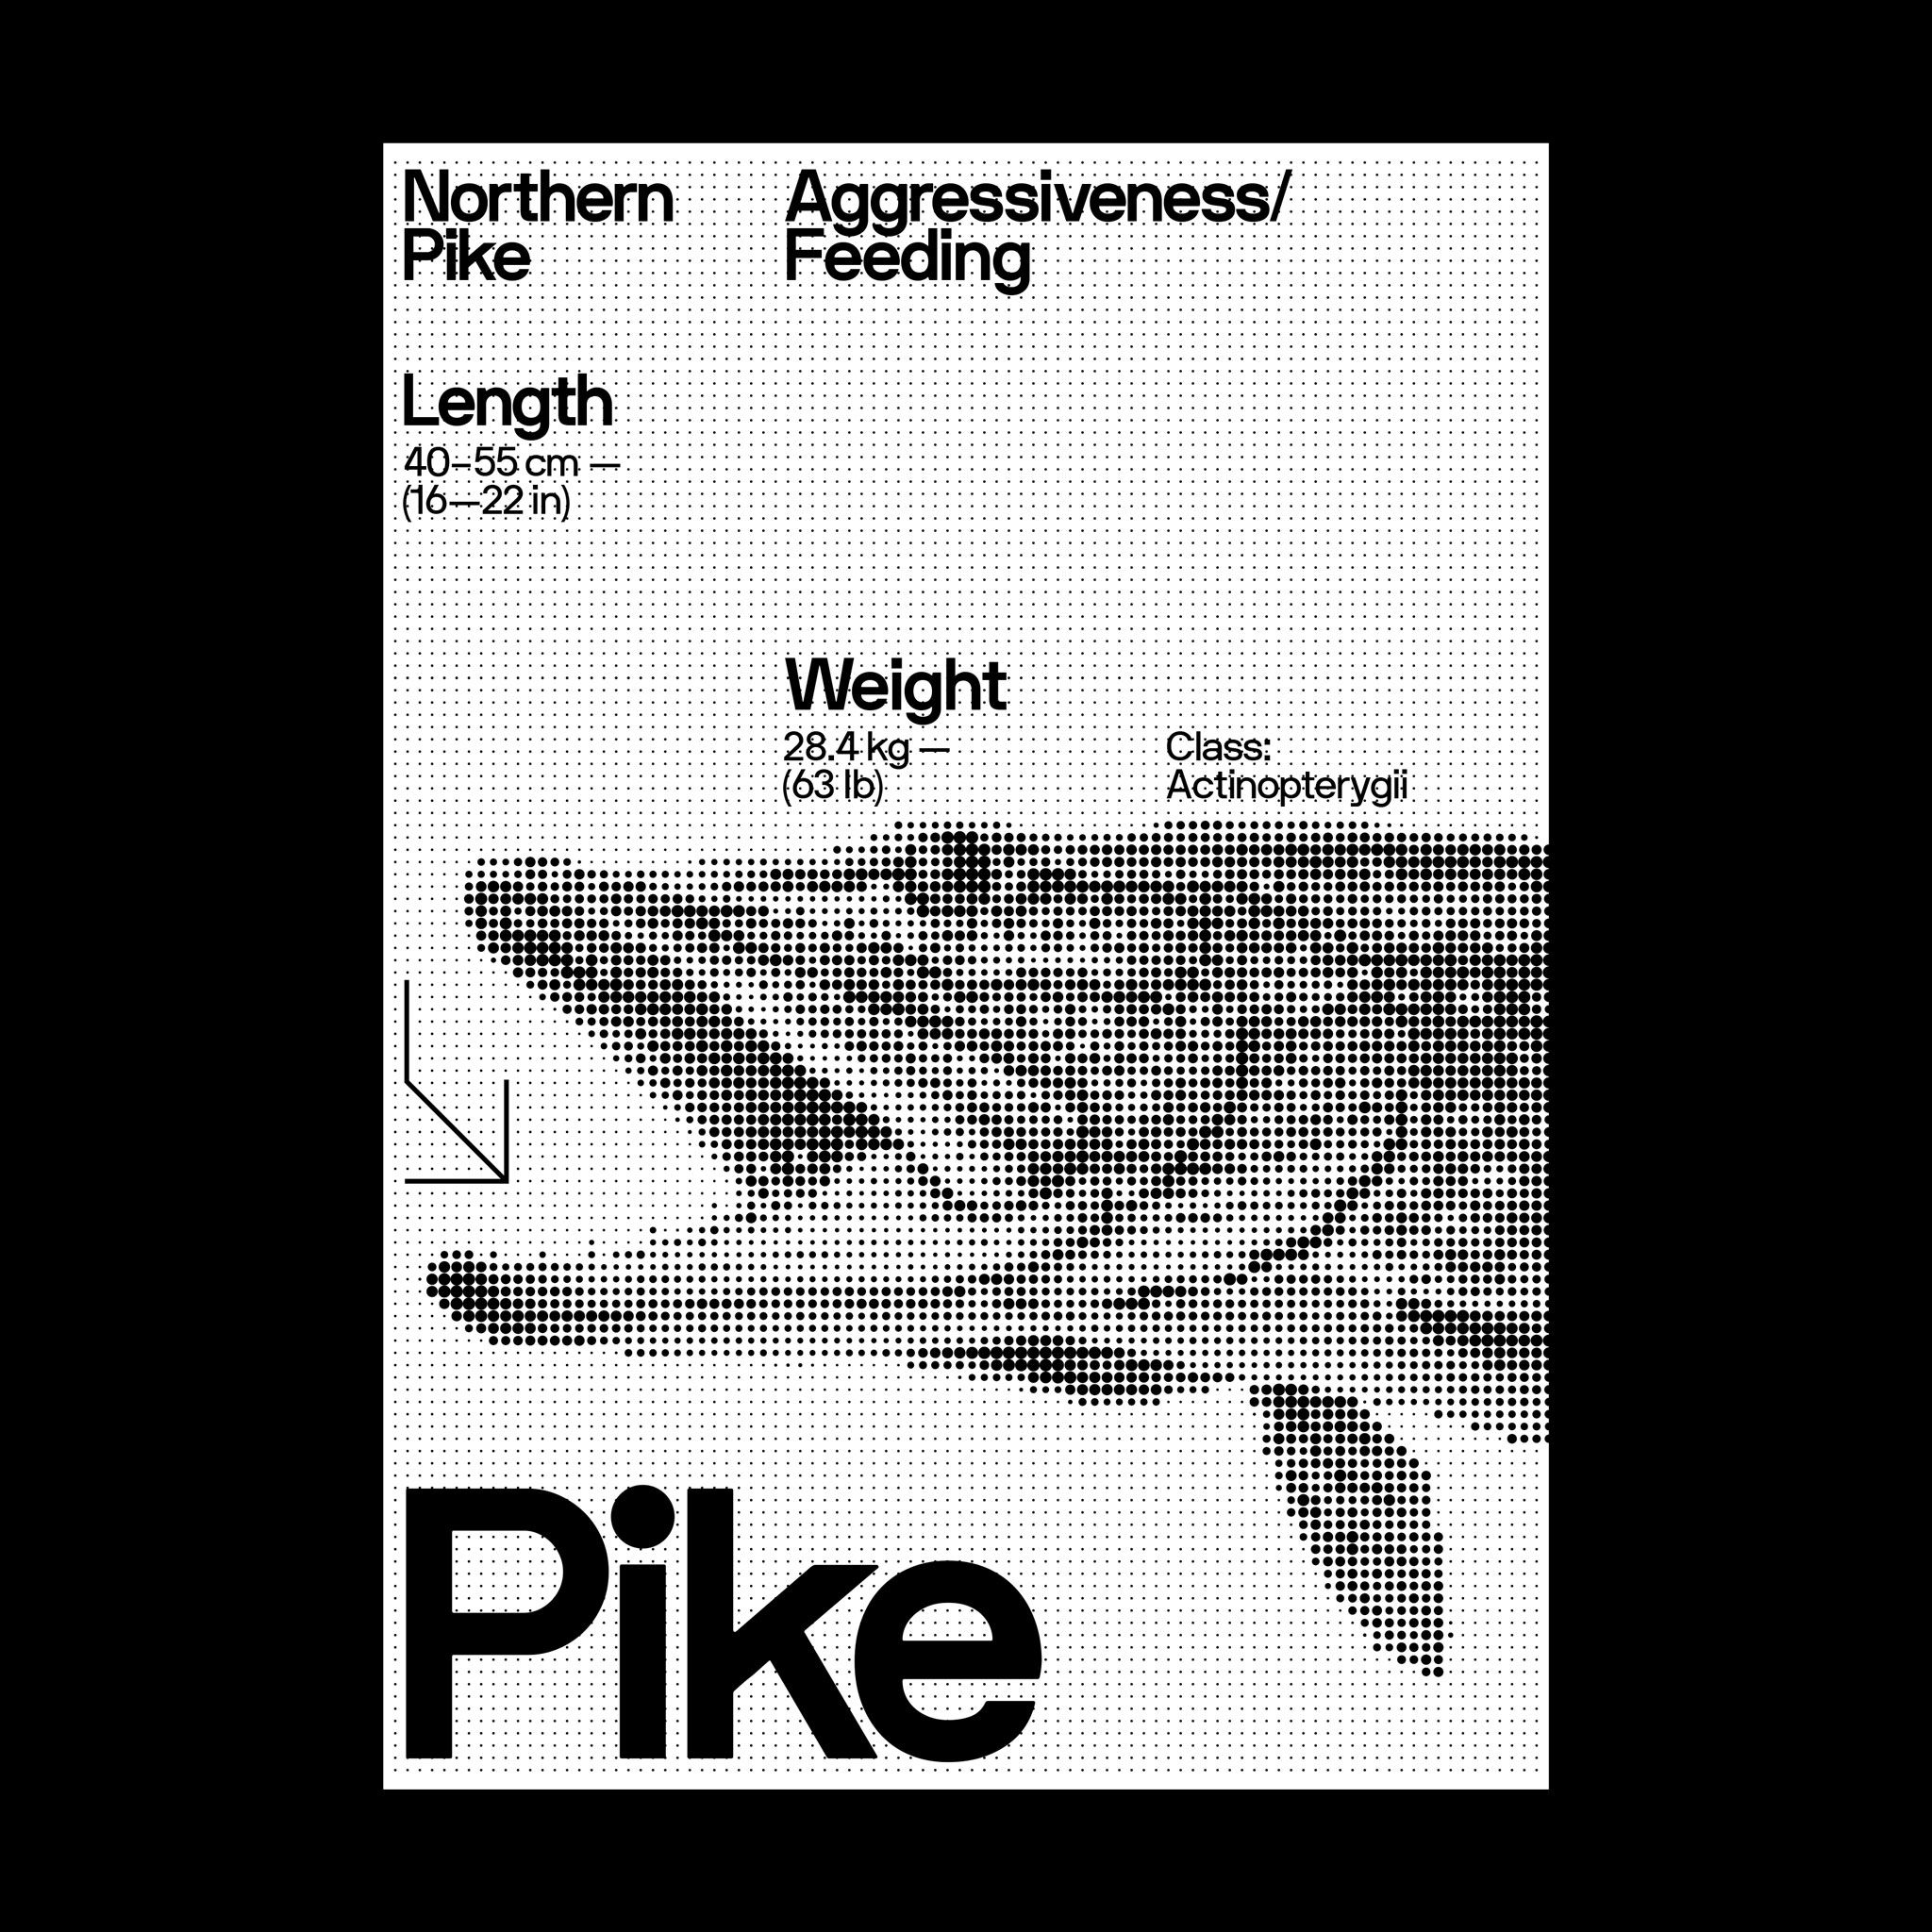
A minimalist Swiss-style informational poster featuring a Northern Pike rendered in halftone dot pattern. The design combines clean typography with scientific data presentation, using stark black and white contrast to create visual hierarchy and technical sophistication.
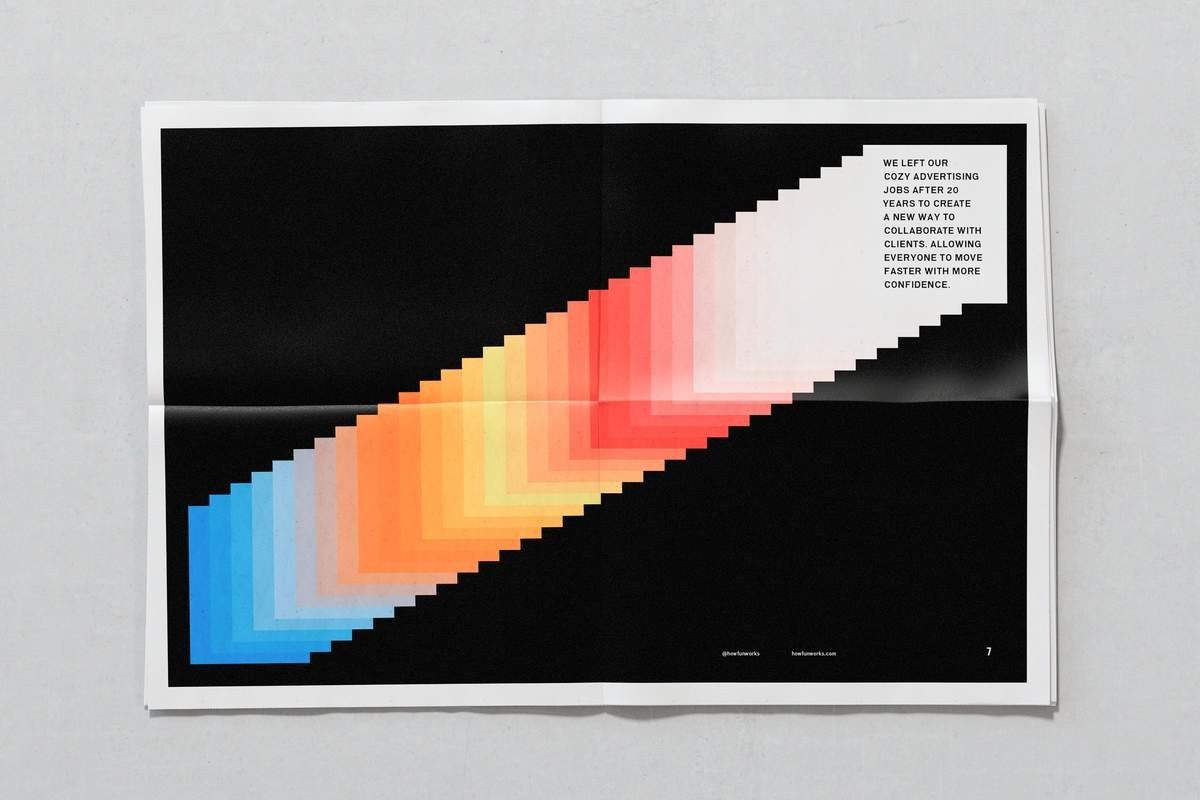
A sophisticated data visualization poster featuring a pixelated gradient flow that transitions from cool blues through warm oranges and reds to pale whites. The design employs a minimalist aesthetic with stark black backgrounds and geometric precision, creating a modern, technical visual language that suggests information design or scientific visualization.
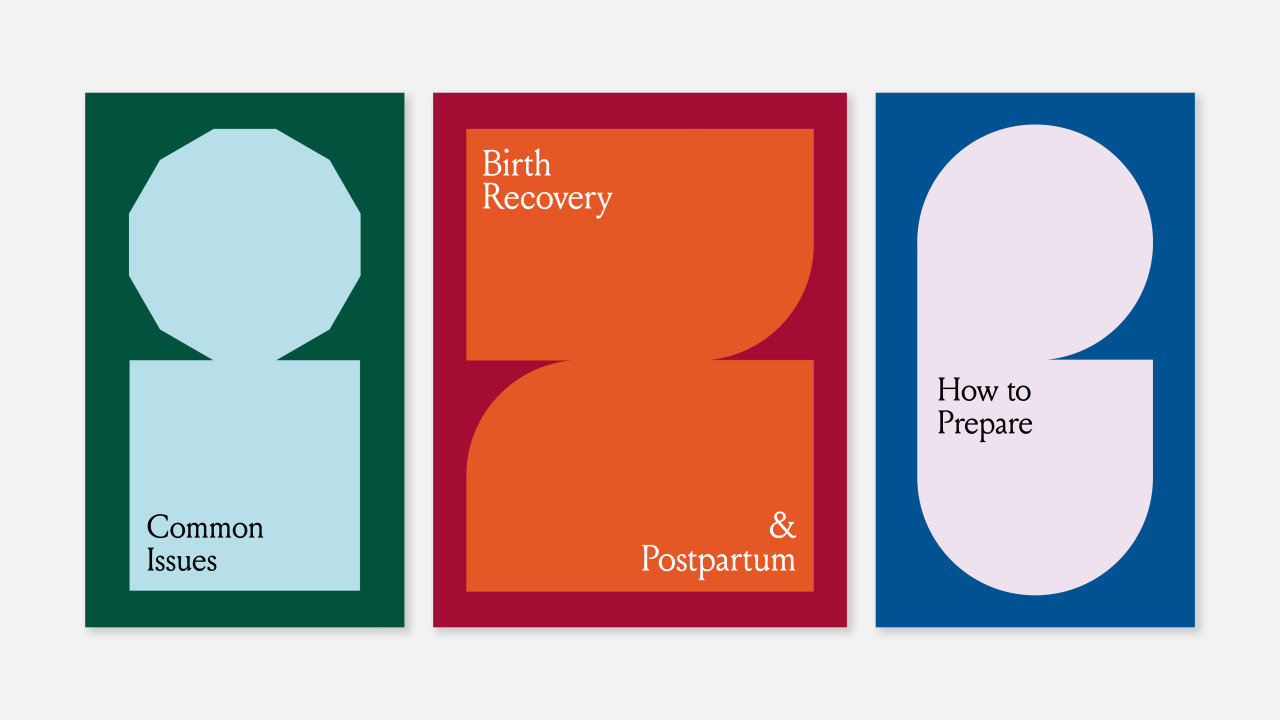
This image presents a clean, modern, and organized set of three vertical panels, utilizing strong color blocking to segment different topics. The design employs simple geometric shapes and high contrast between the background colors and the light interior elements, suggesting a professional and informative tone.
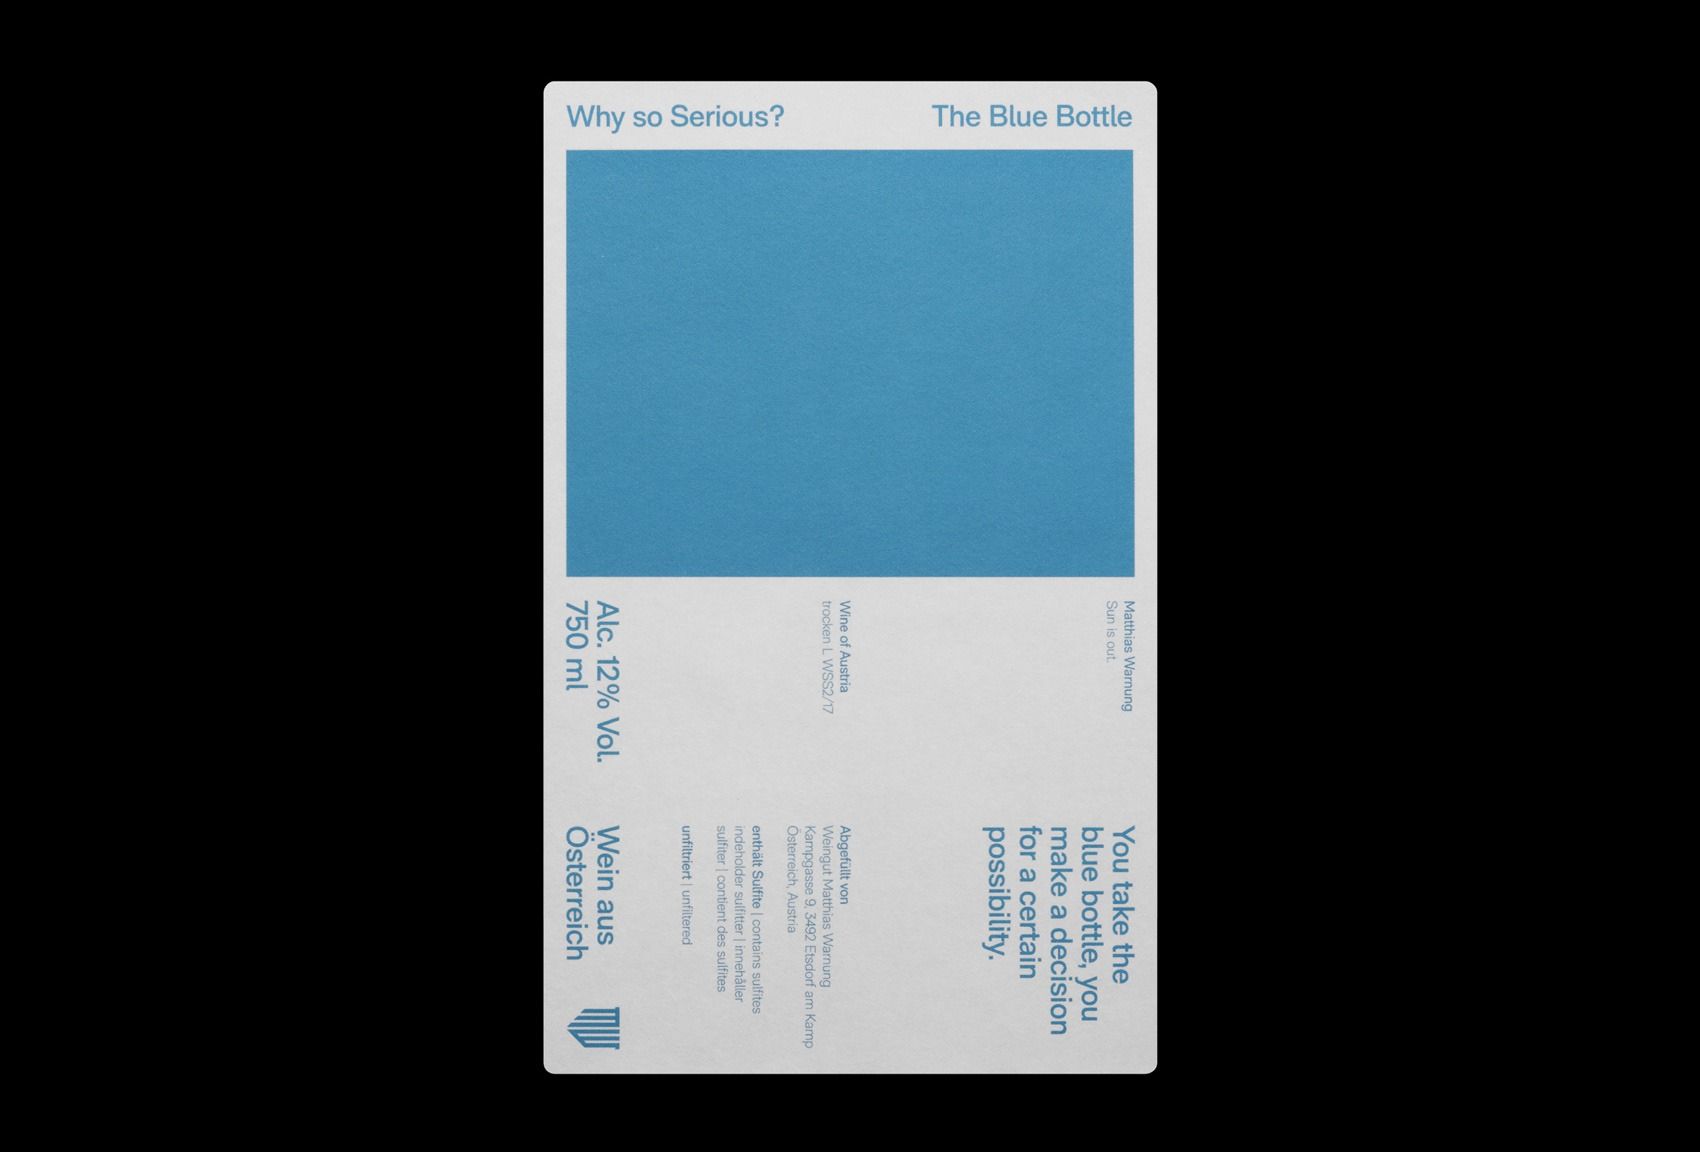
This design employs a highly minimalist and clean visual language, utilizing simple geometric shapes and muted blues to convey information clearly. The design relies heavily on negative space and solid color blocking to establish a sense of professionalism and quiet sophistication.
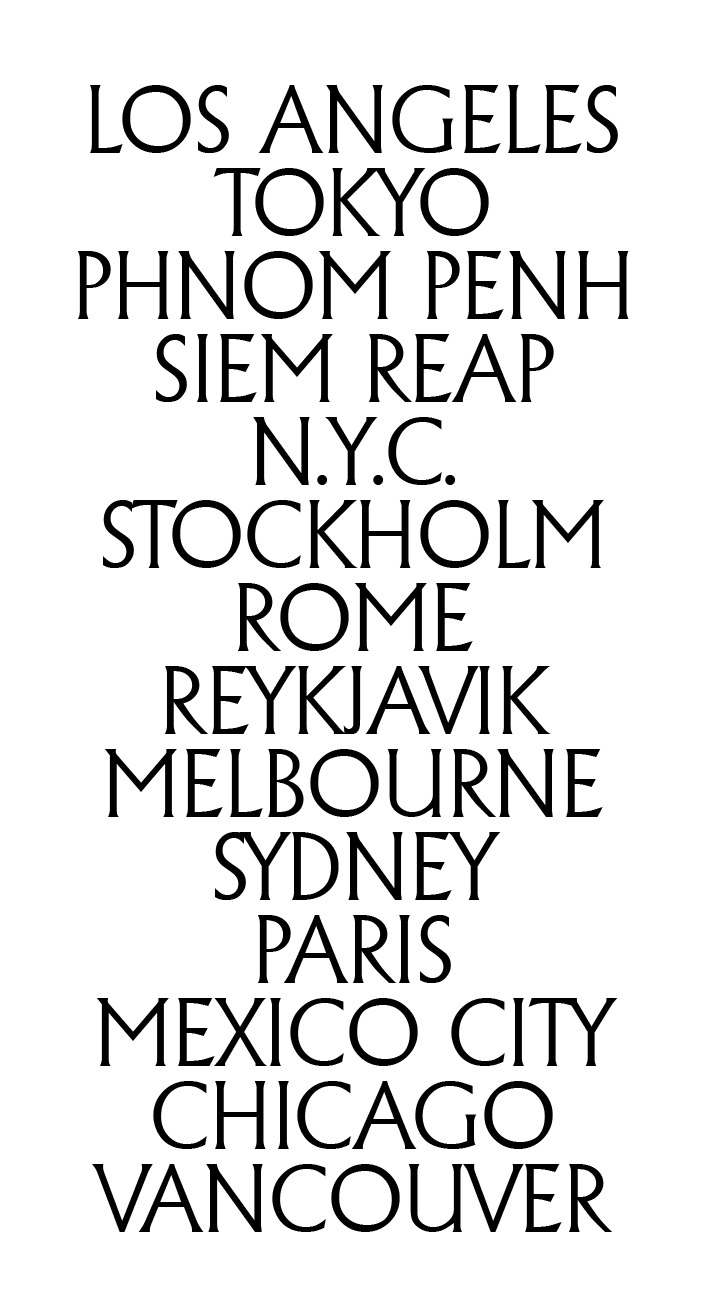
This design utilizes a clean, minimalist typographic approach to present a dense list of global city names. The visual language is stark and relies entirely on high contrast between black text and a white background, emphasizing clarity and straightforward information delivery.
This design employs a minimalist aesthetic characterized by high contrast between the deep, muted background and the soft, light outlines. The visual language relies on clean geometric shapes and ample negative space to present information clearly and elegantly.
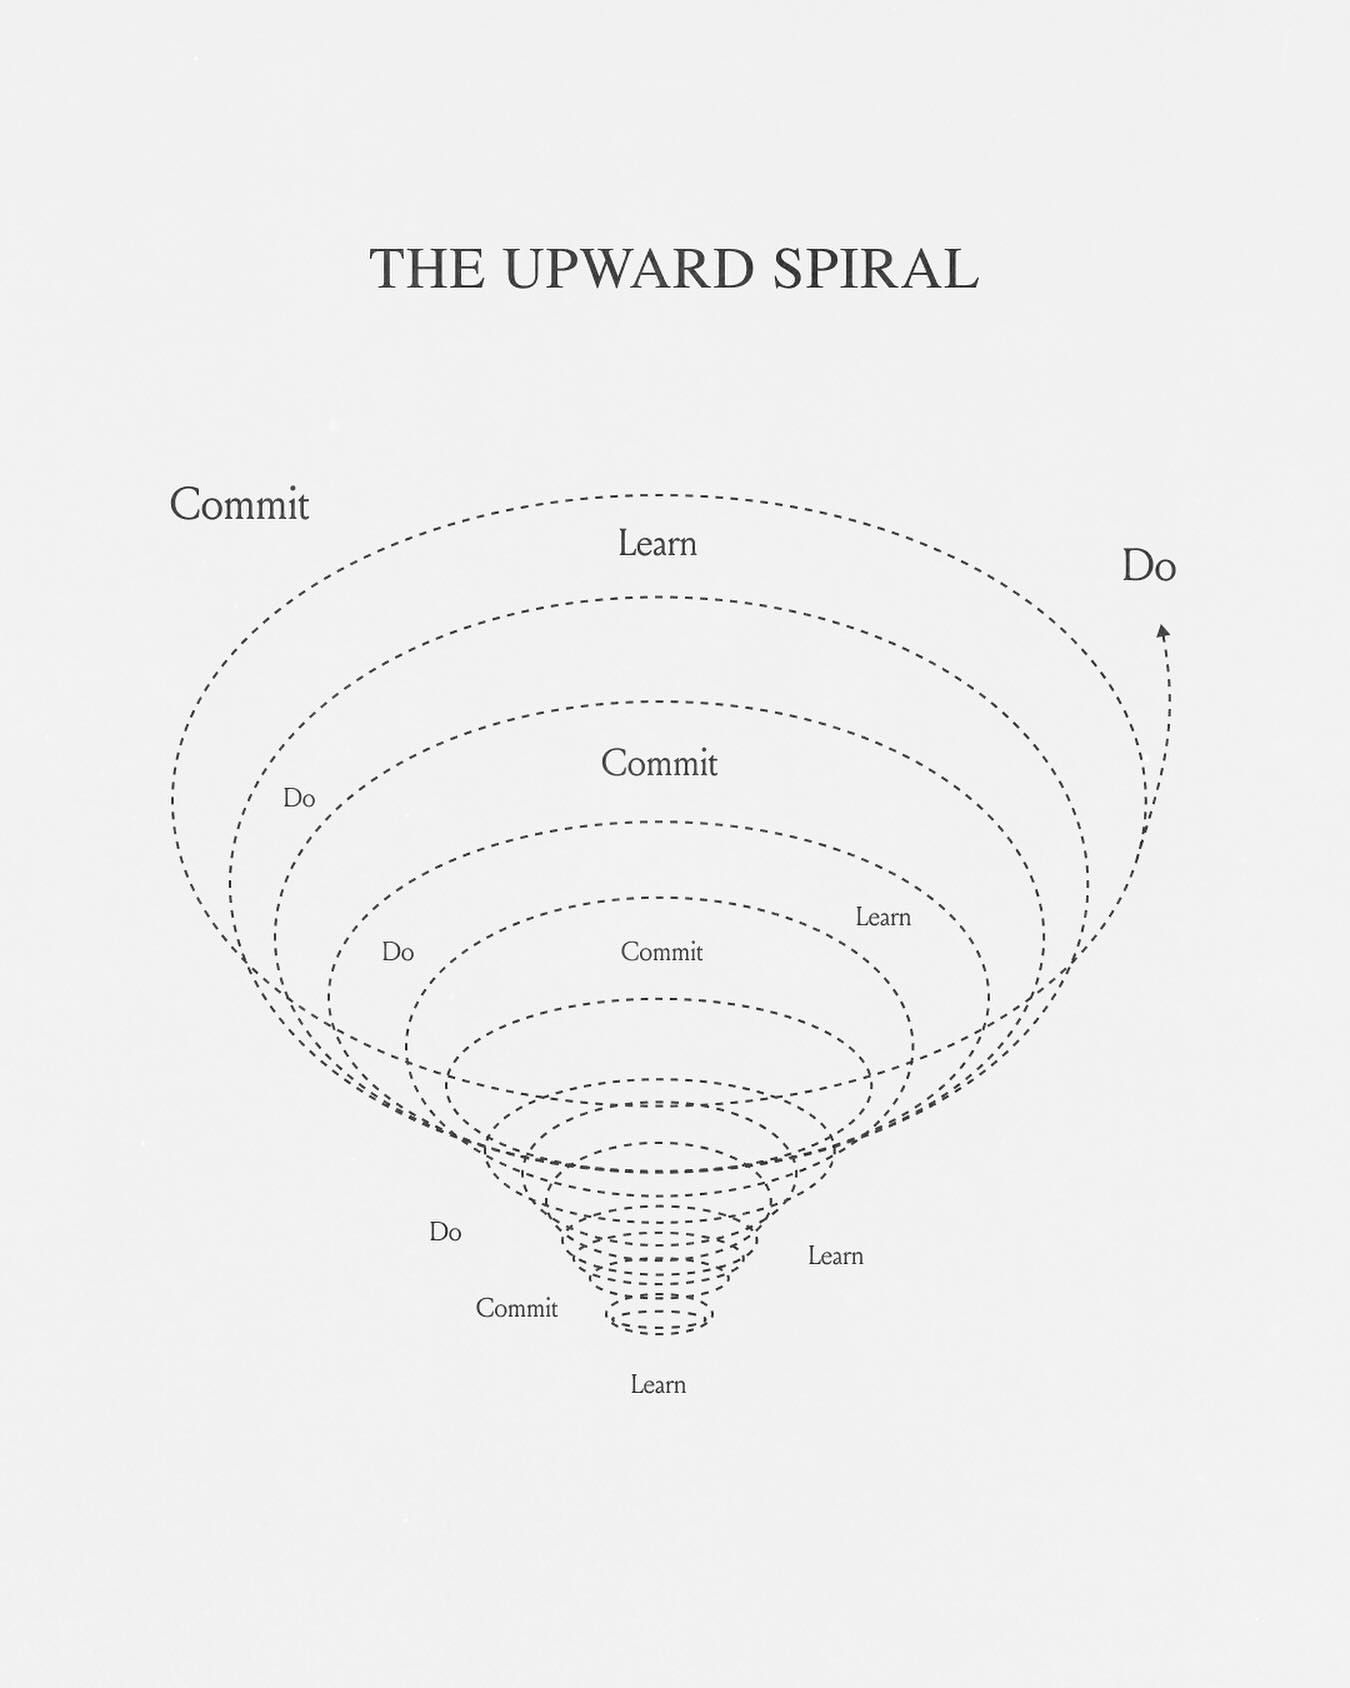
Infographic design titled 'The Upward Spiral' showing data visualization and information hierarchy. Features icons, typography, and organized layout for complex data.