infographic design
11 designs
Showing 11 of 11 (11 total)
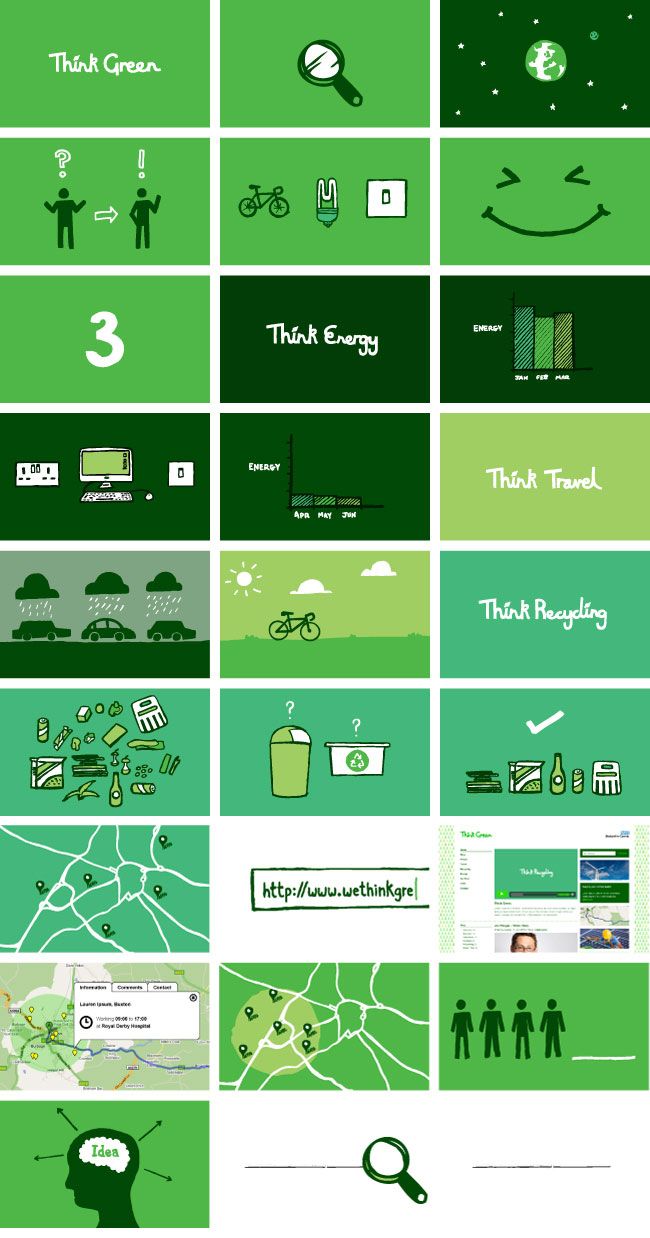
This is a clean, educational infographic utilizing a vibrant green palette and a structured grid layout to convey environmental concepts. The design is highly organized, using simple icons and clear text to break down complex ideas into digestible segments.
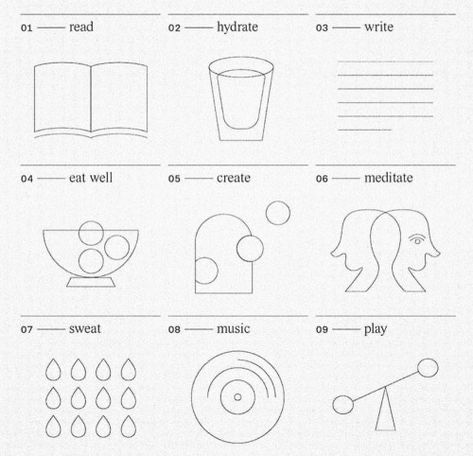
A minimalist infographic grid presenting nine wellness and lifestyle activities through simple line-drawn icons. The design uses a clean, monochromatic aesthetic with thin strokes and ample whitespace, creating an educational and accessible visual system. The layout emphasizes clarity and conceptual simplicity, making complex ideas immediately recognizable.
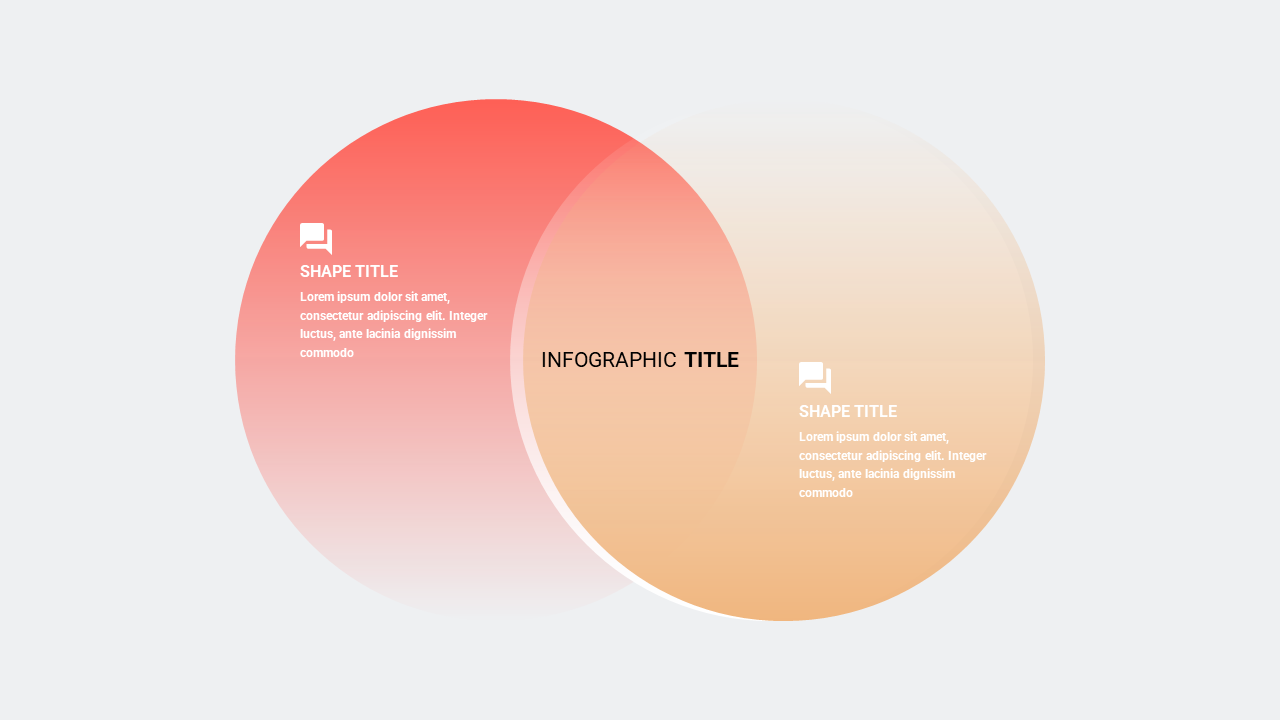
A soft, modern infographic design featuring two overlapping circles with gradient fills in coral and peach tones. The composition uses translucent, rounded shapes with subtle text labels and icons, creating a minimalist and contemporary aesthetic suitable for data visualization or presentation slides.
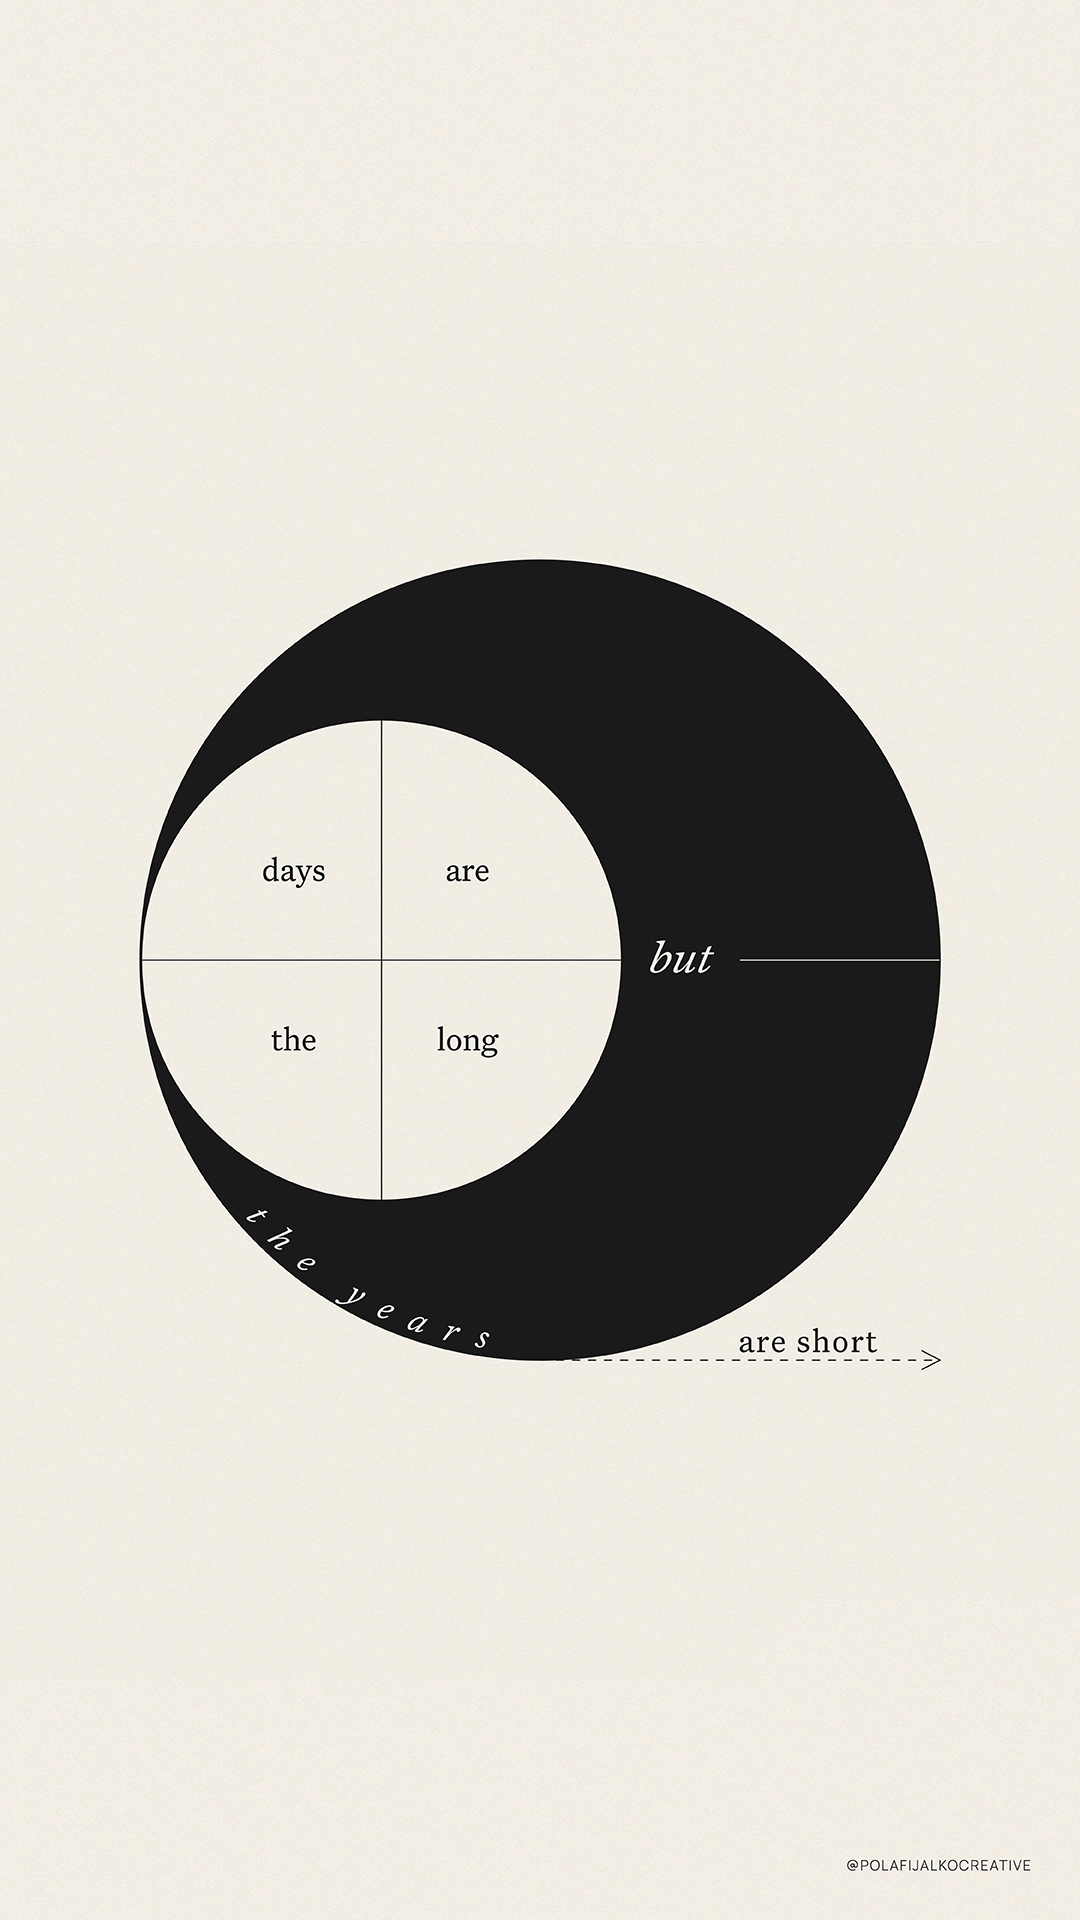
A minimalist infographic featuring a circular diagram with contrasting black and white sections, presenting a philosophical statement about time through geometric abstraction. The design uses clean lines, negative space, and a restrained color palette to convey a contemplative message about the brevity of life.
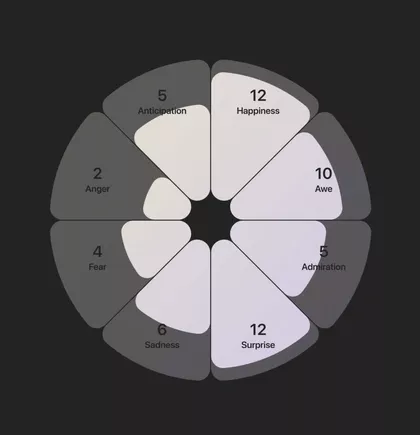
This is a highly structured, minimalist infographic using radial symmetry to categorize and visualize various emotions. The design relies on subtle tonal variations within the grayscale palette to create depth and differentiate the segments clearly.
This is a clean, modern infographic design utilizing strong color blocking and large numerical typography to present comparative statistics effectively. The visual language is direct and analytical, relying on simple icons and high contrast to ensure the data points stand out.

This design features a clean, minimalist data visualization using geometric shapes and flat color blocking to represent quantitative data. The visual language is simple, focusing purely on clarity and the relationship between measured values.
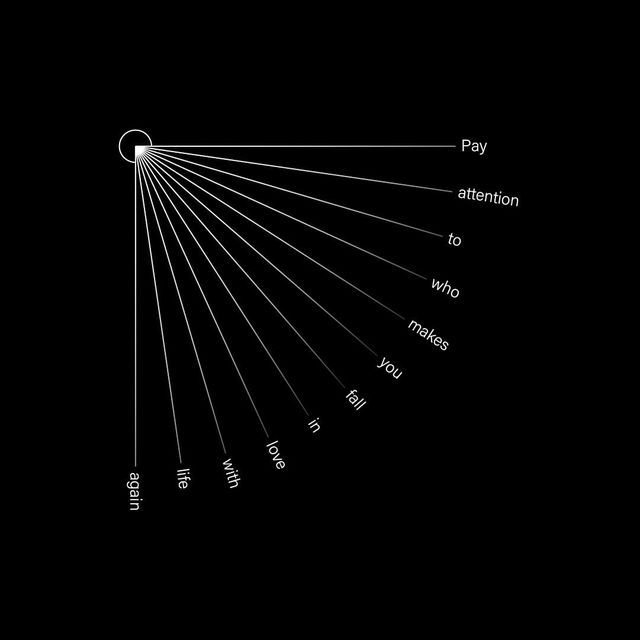
This is a highly minimalist diagram utilizing line art to depict relationships or dependencies radiating outward from a central point. The design relies purely on negative space and the crisp contrast between white lines and the deep black background to establish a clear visual hierarchy. The overall feel is academic, structured, and conceptually focused.
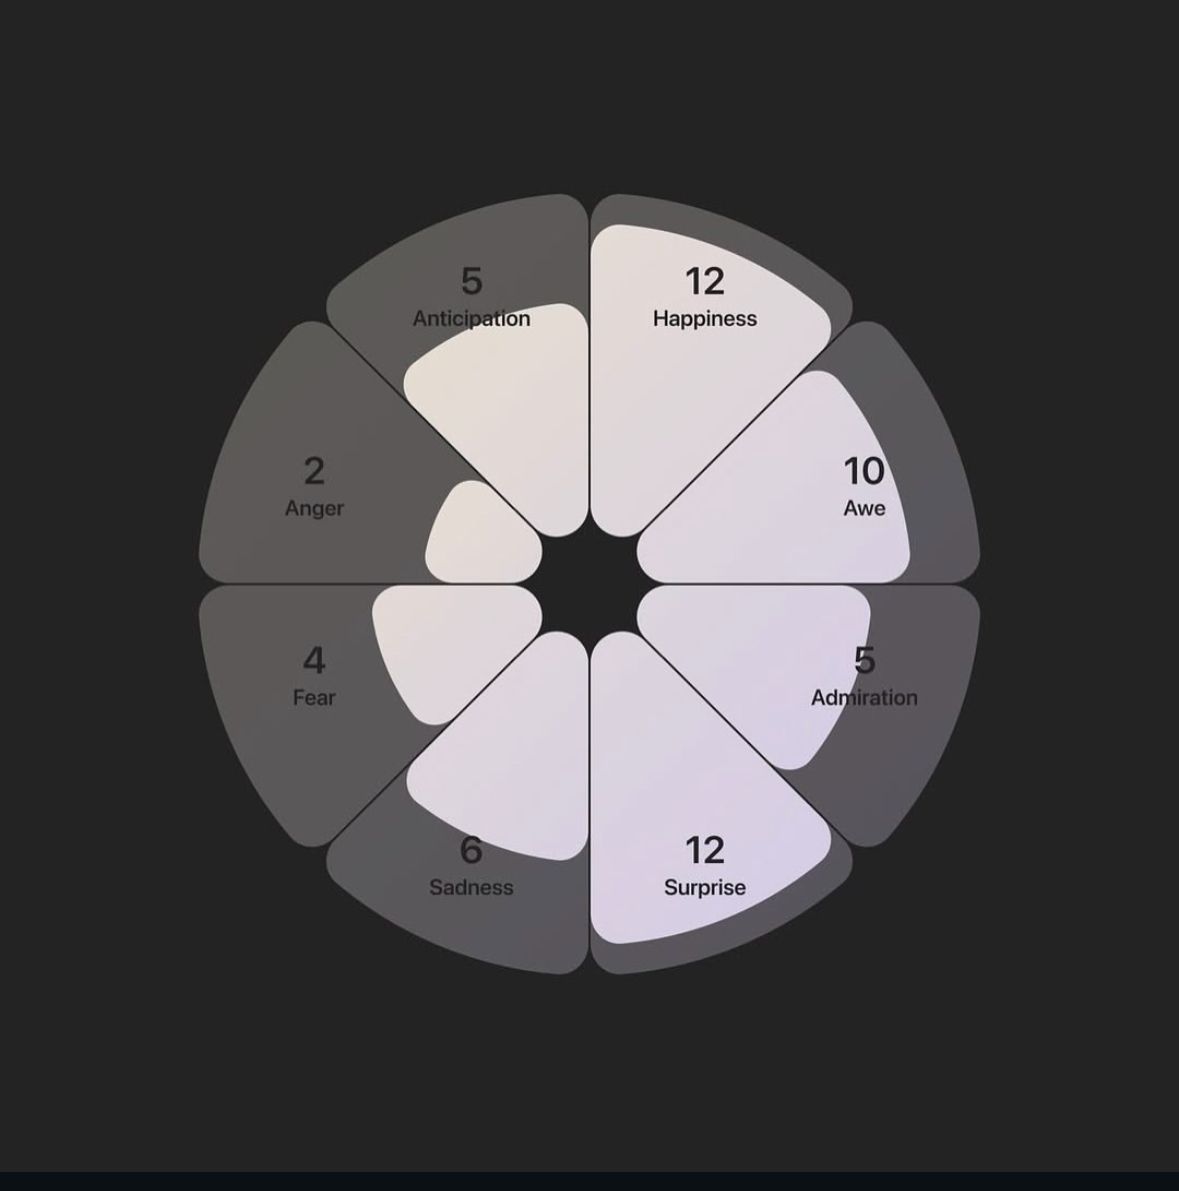
This image presents a highly structured, radial infographic design using grayscale tones to map out various emotions or concepts. The visual language is clean and minimalist, focusing on clear segmentation and balanced symmetry to convey complex information quickly.
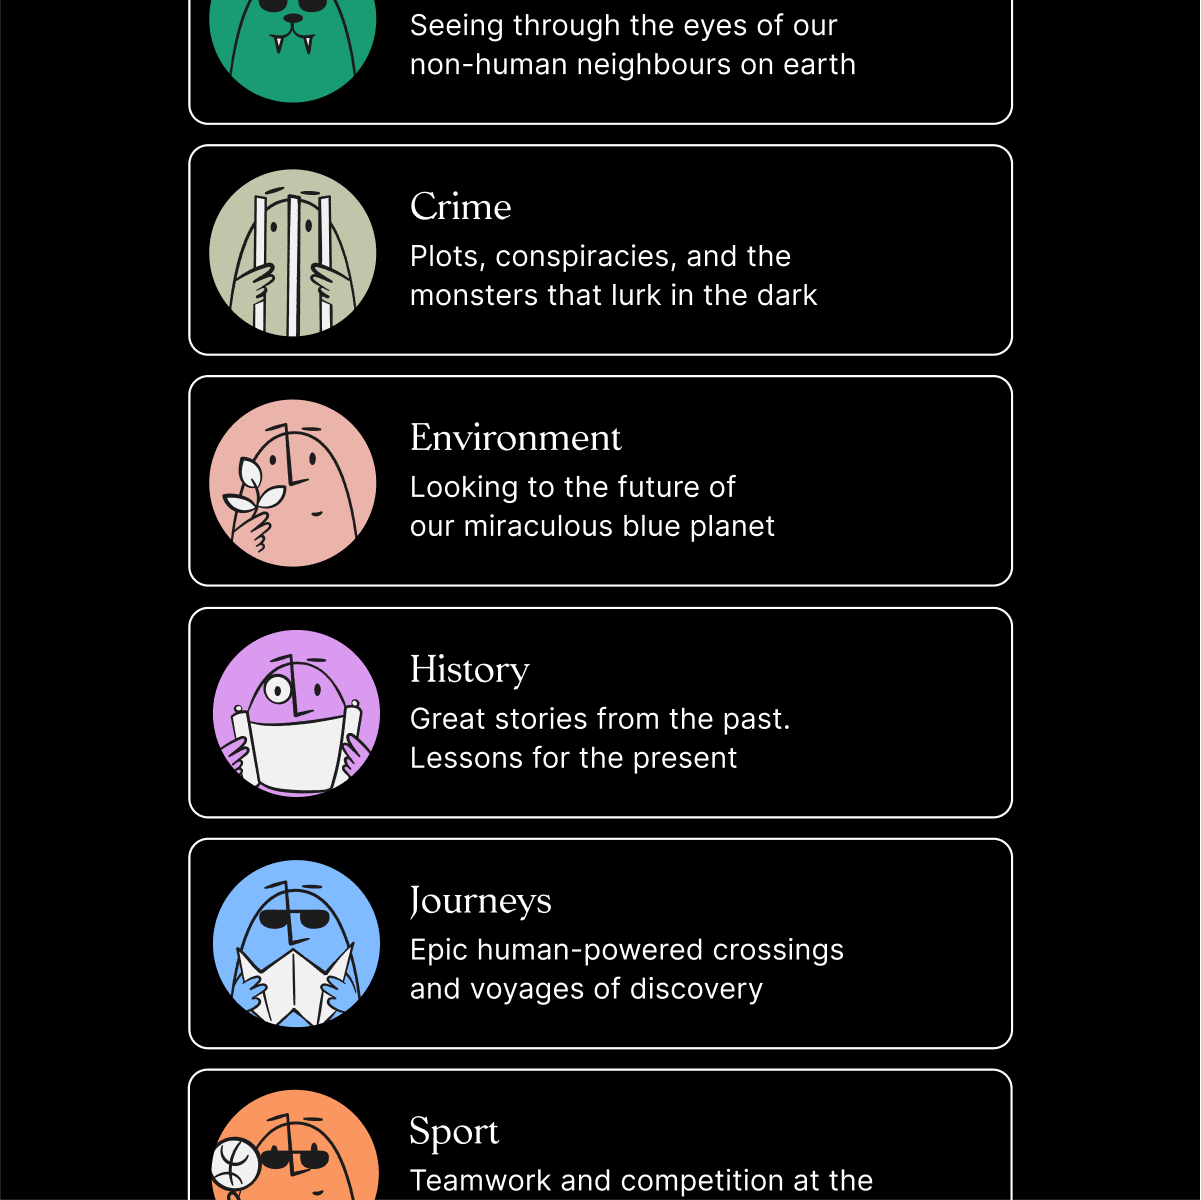
This design utilizes a clean, modular card layout featuring hand-drawn or line-art illustrations against soft pastel backgrounds. The visual language is approachable, friendly, and illustrative, successfully linking abstract concepts with engaging imagery.
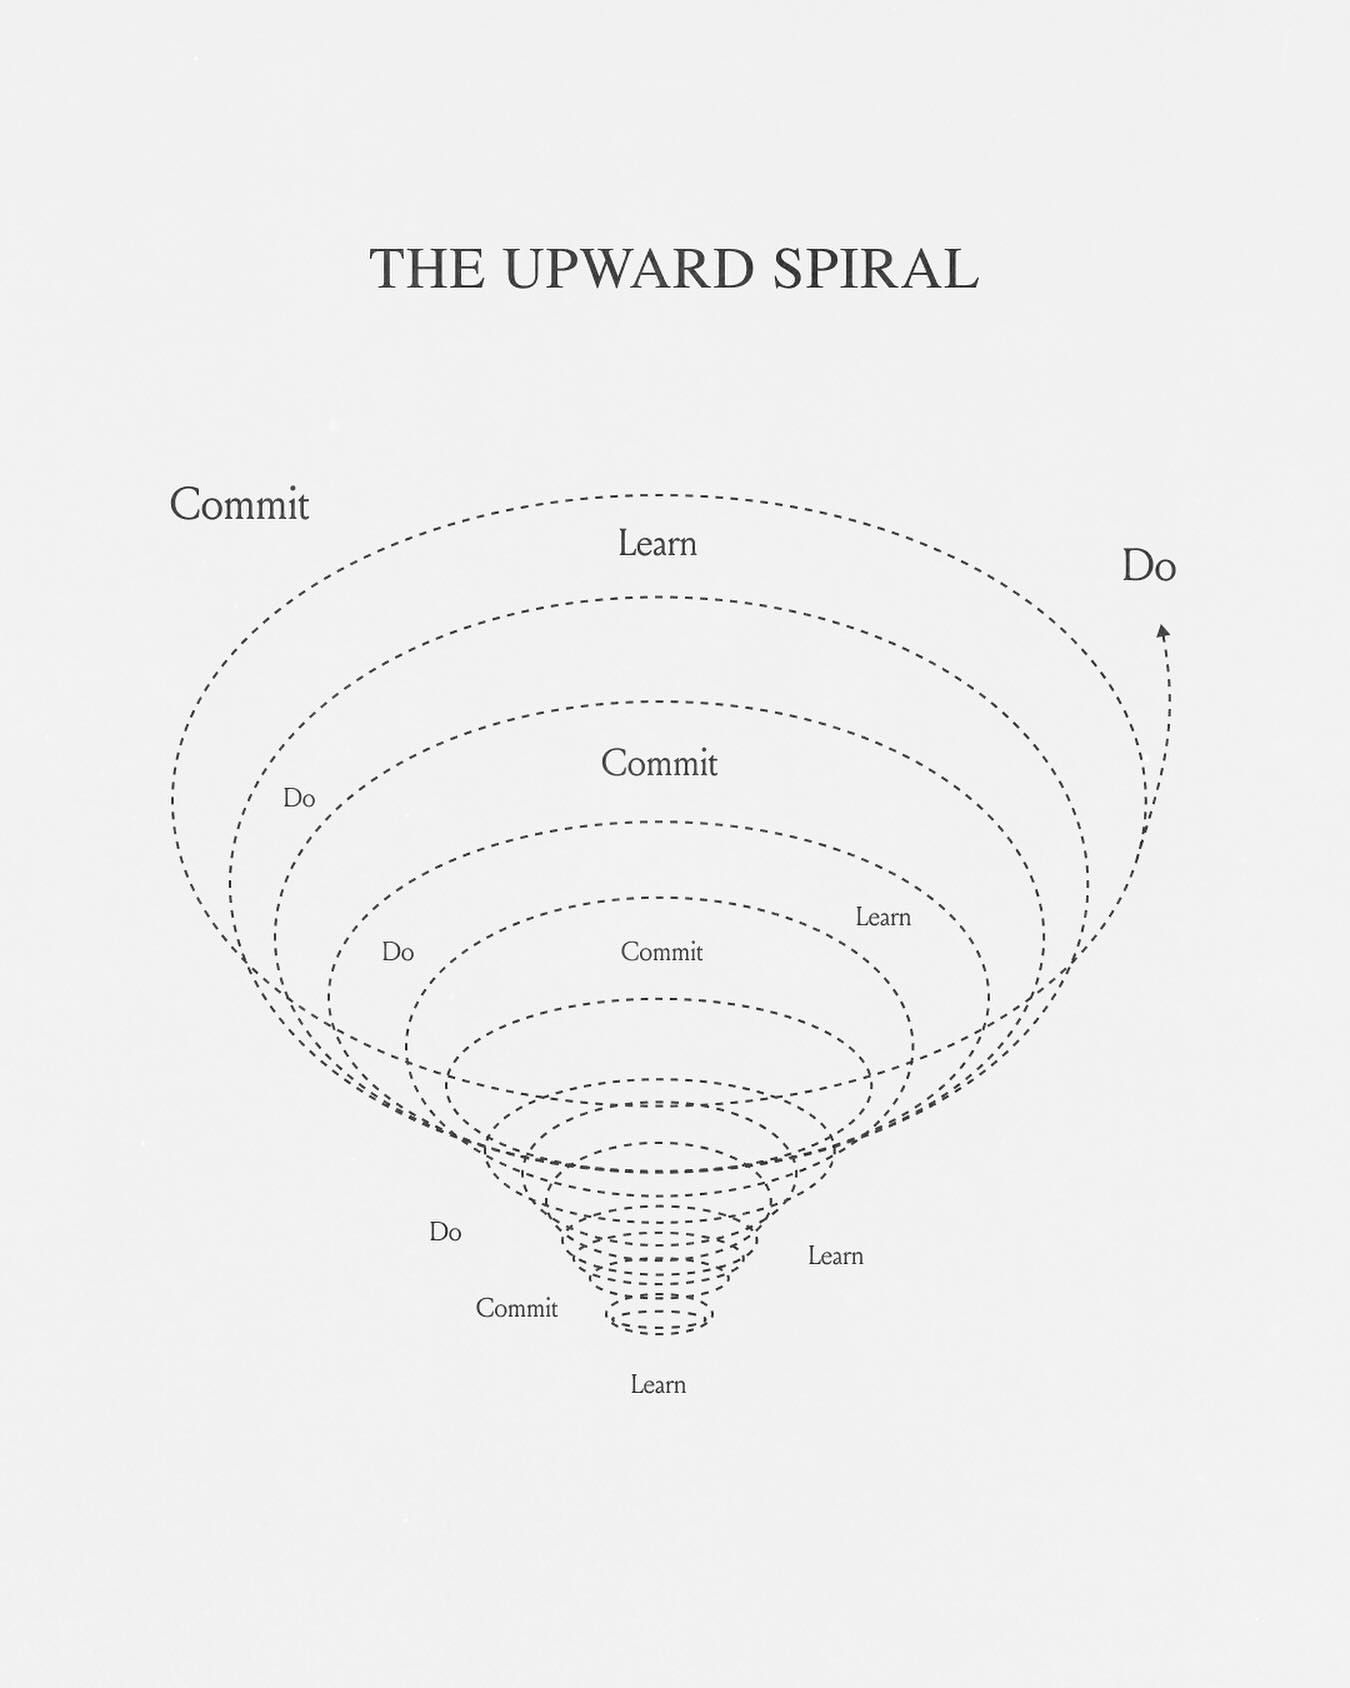
Infographic design titled 'The Upward Spiral' showing data visualization and information hierarchy. Features icons, typography, and organized layout for complex data.