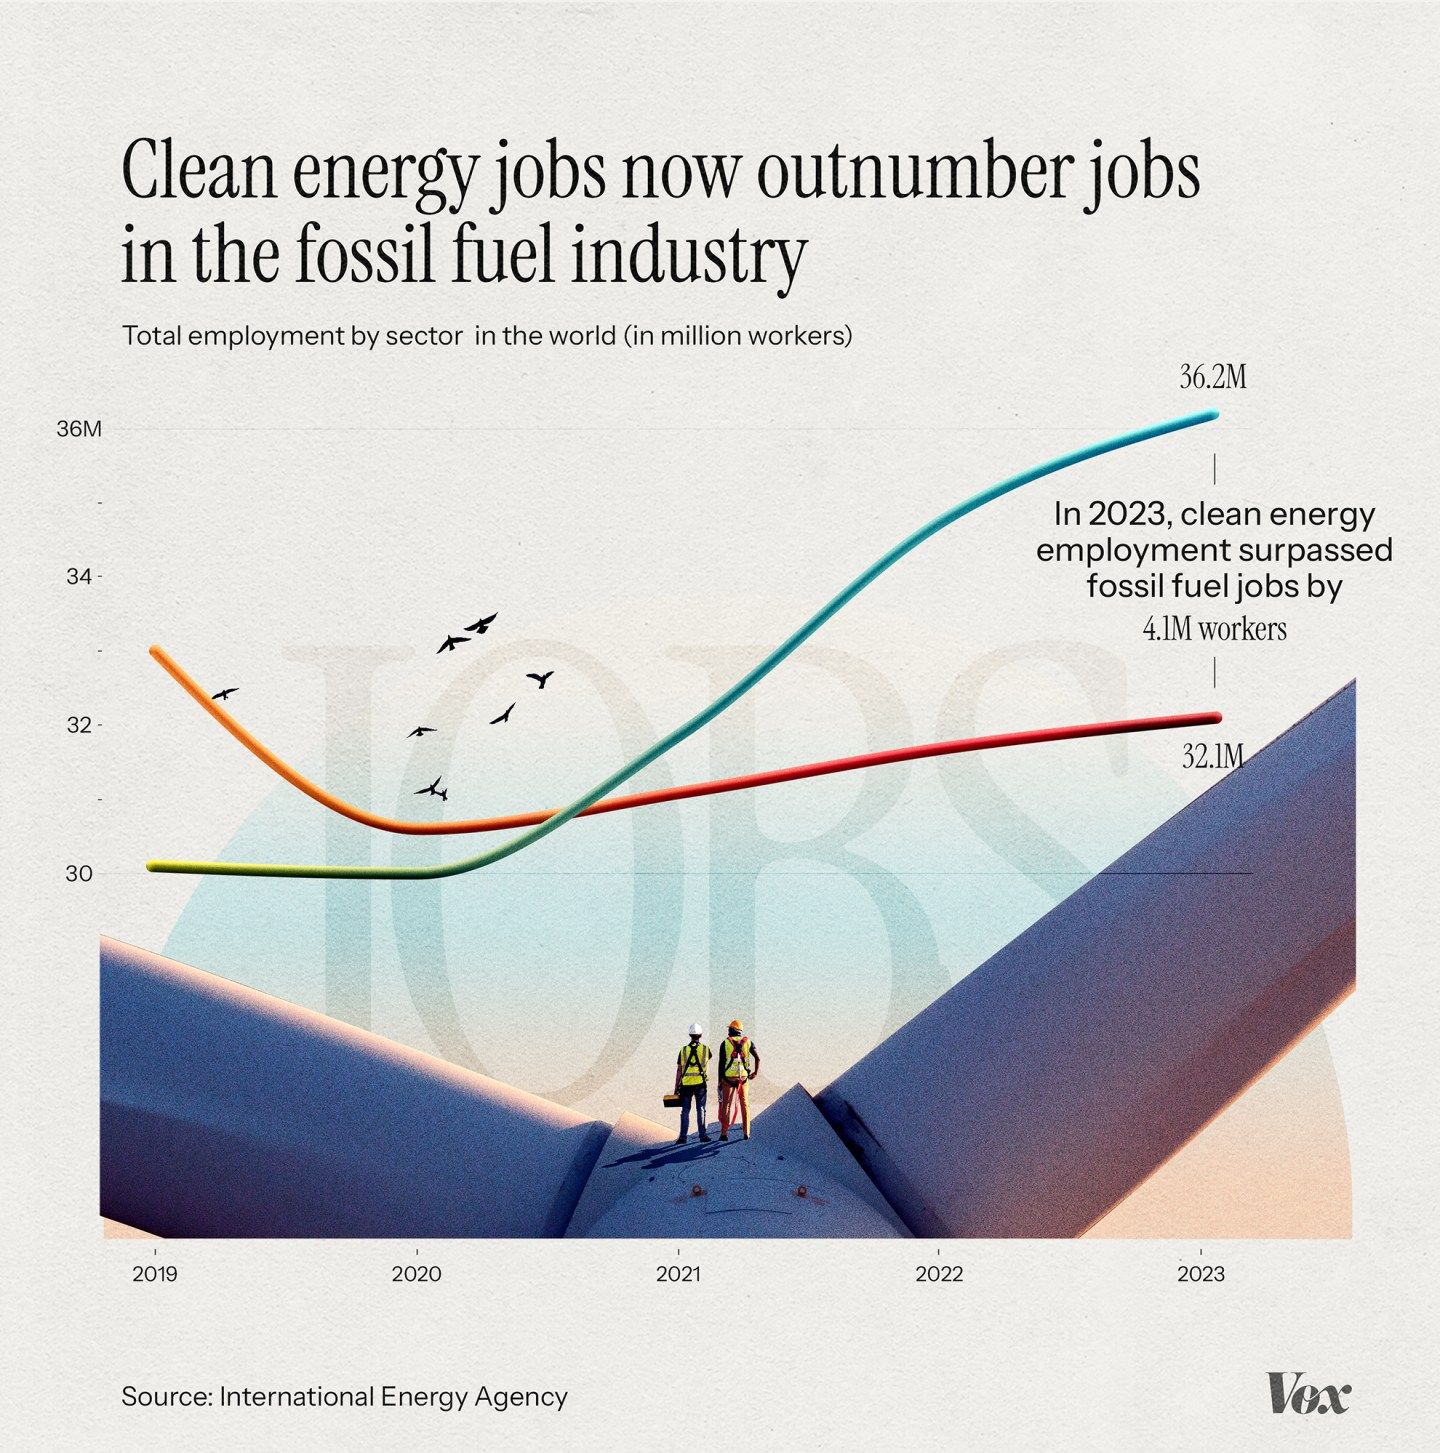
The infographic uses a clean, modern, and optimistic visual language to present data comparing job growth in the clean energy sector against the fossil fuel industry over time. The design relies on a simple line graph overlaid on a stylized landscape to create a narrative about transition and positive change.
infographicline graphminimalist