environmental science
23 designs
Showing 23 of 23 (23 total)
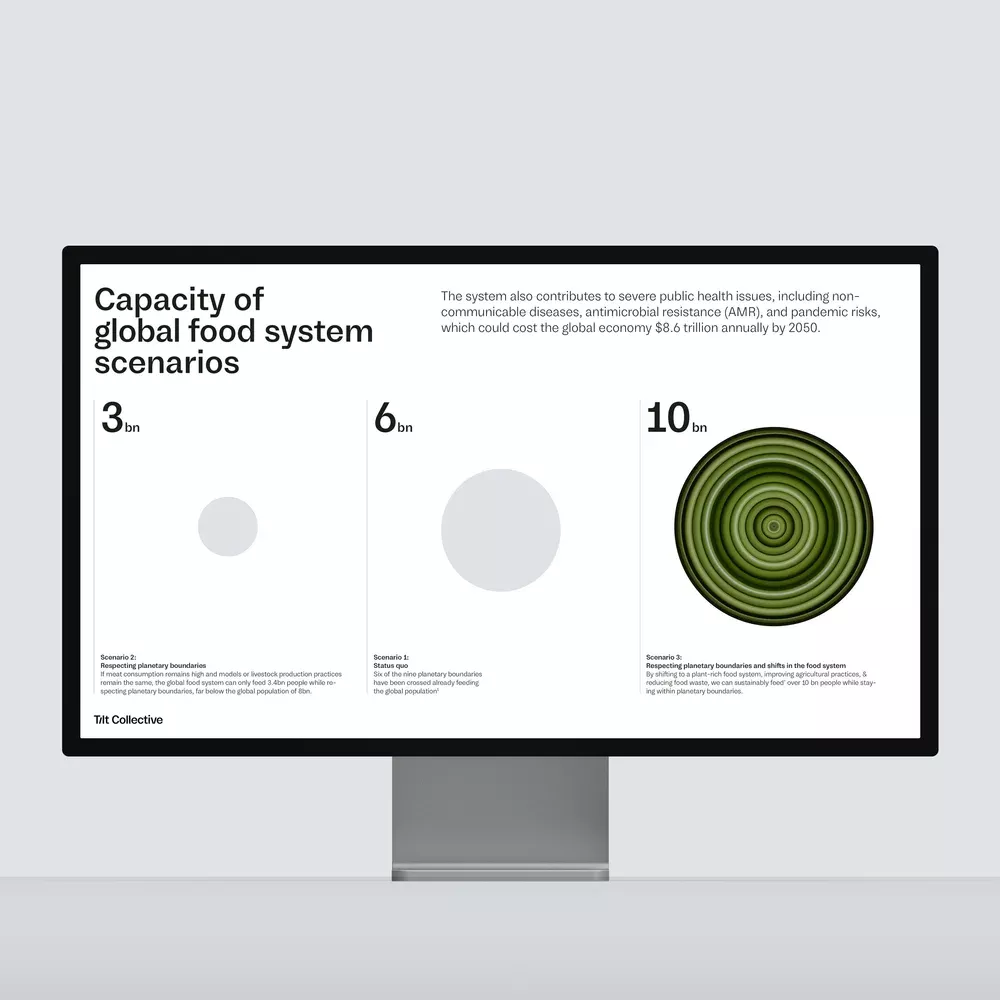
This is a clean, professional data visualization slide utilizing a minimalist design approach to present comparative scenarios. The visual language relies on stark contrast and simple geometric shapes to clearly communicate large numerical data points.
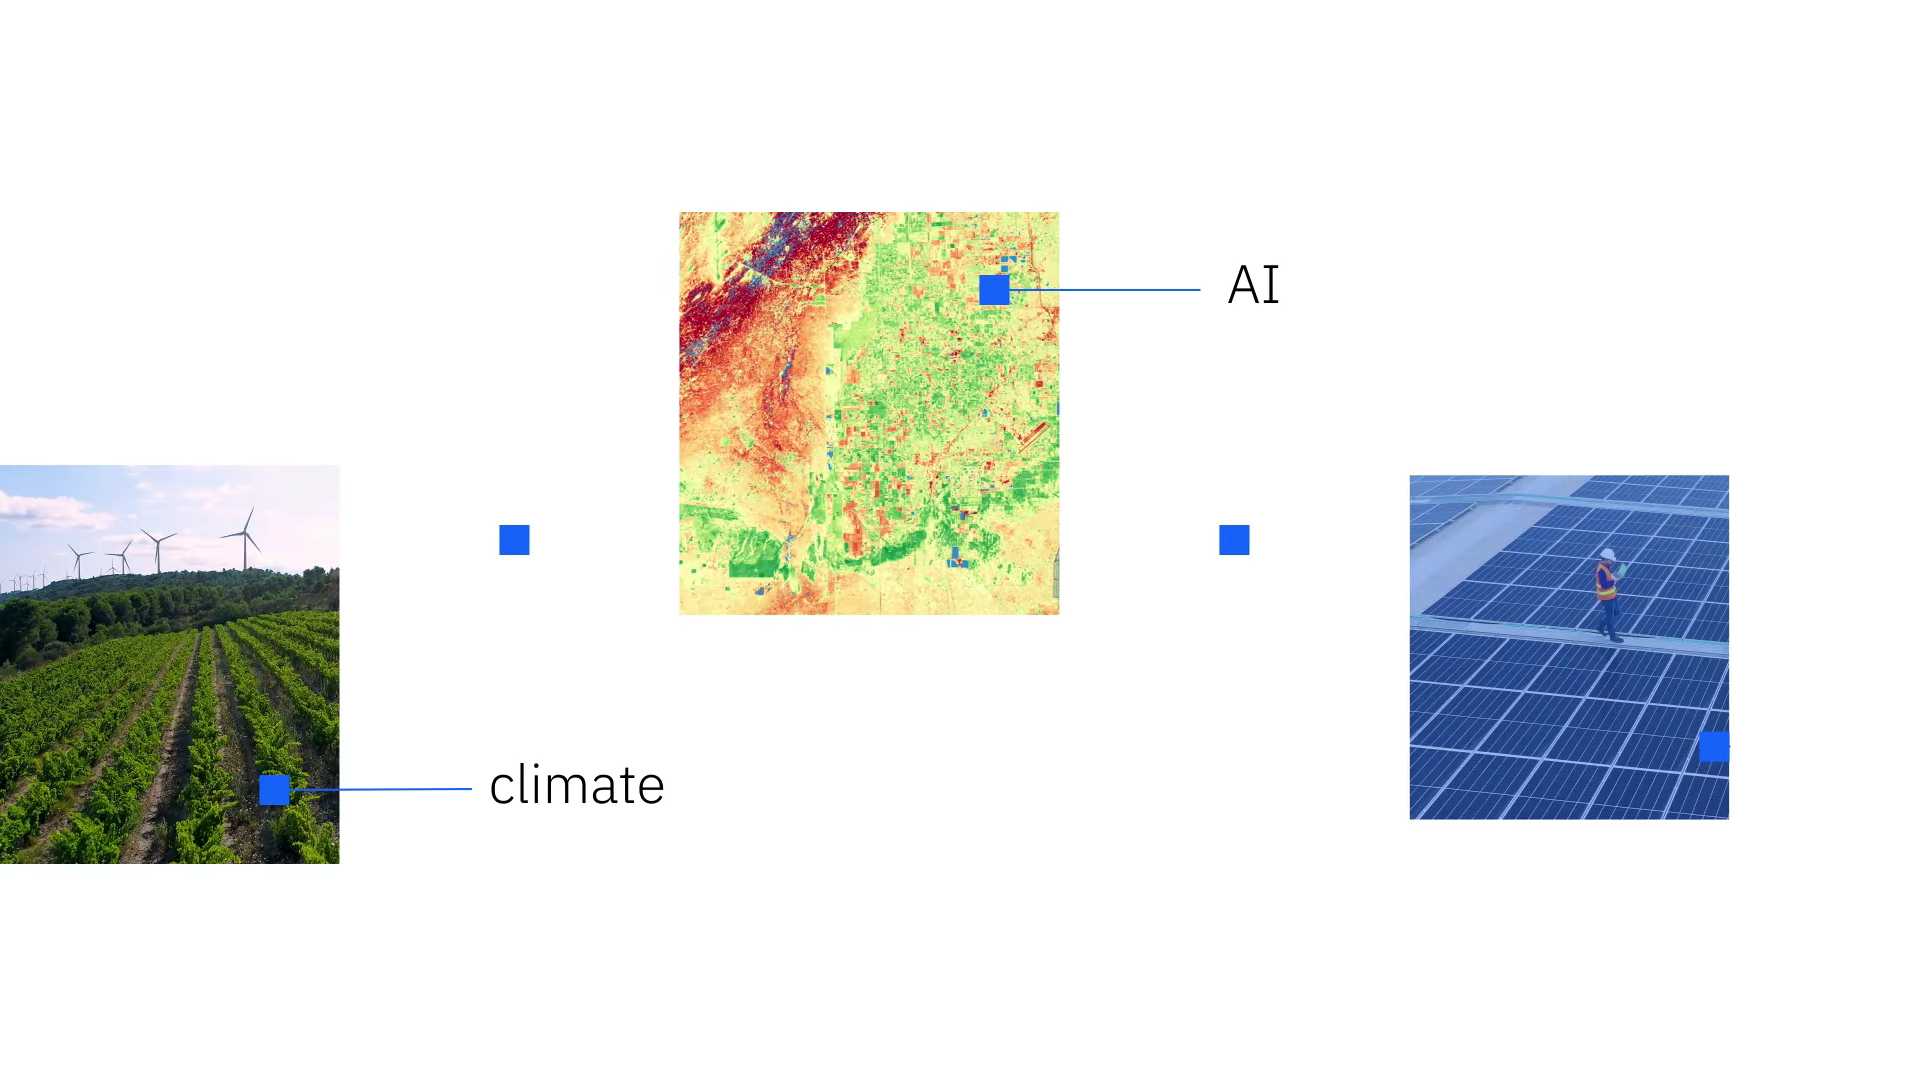
The image presents a conceptual flow diagram illustrating the relationship between climate data, an AI model output, and solar energy generation. The visual language is clean and schematic, using distinct blocks to represent different data sources and outputs in a linear progression.
The design is clean, informative, and serious, utilizing a stark contrast between white/light blues and dark text to convey scientific gravity. The layout is balanced, separating a large title block from an accompanying photographic element.
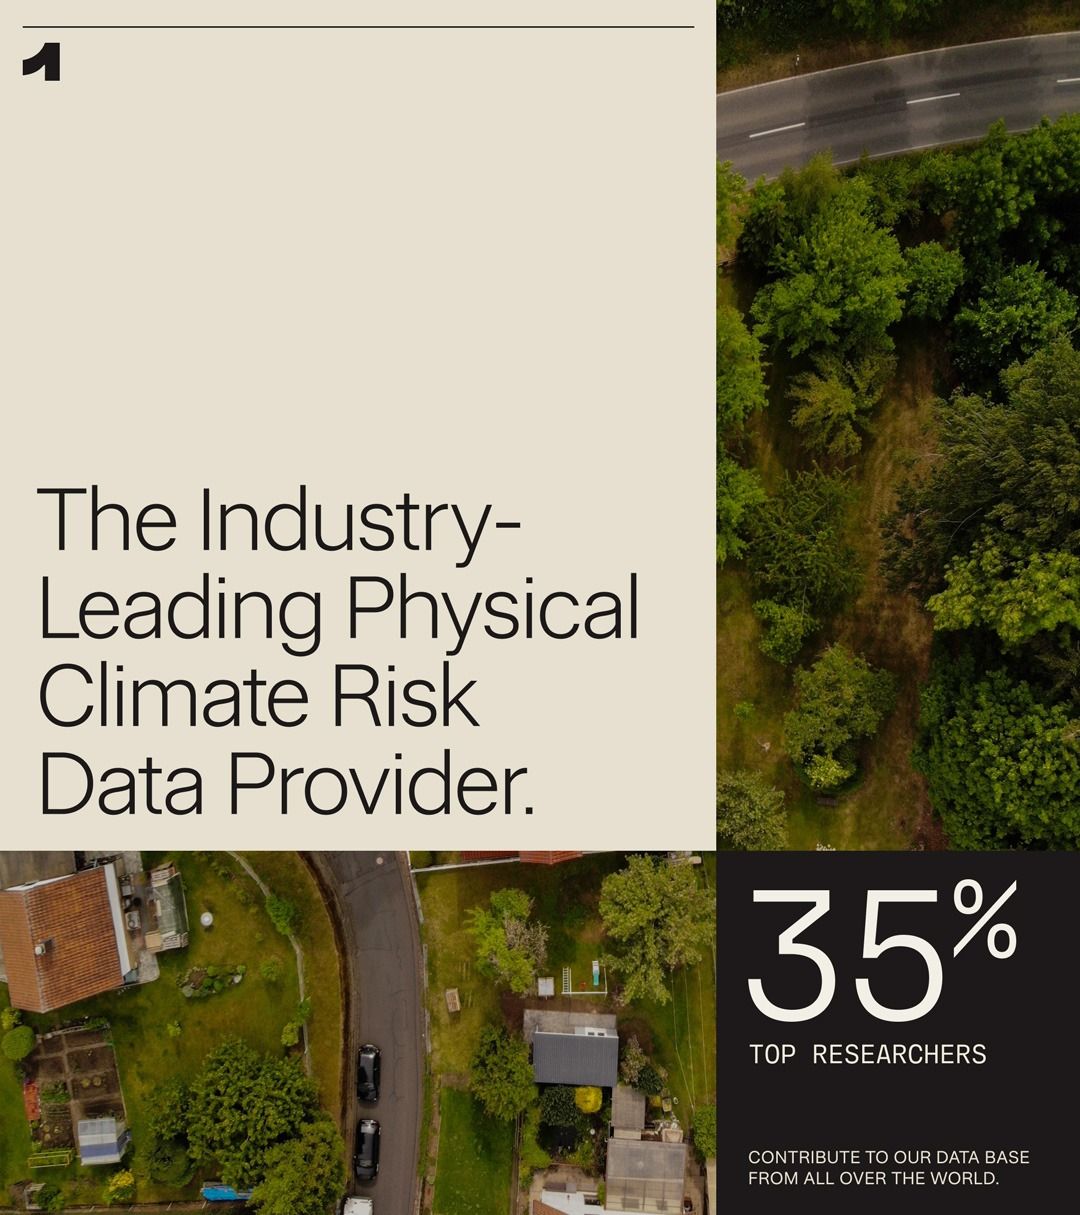
The image presents a clean, professional layout combining large blocks of white space with photographic imagery to convey expertise in climate risk data. The design is modern and corporate, using high-quality visuals alongside clear textual hierarchy to establish authority.
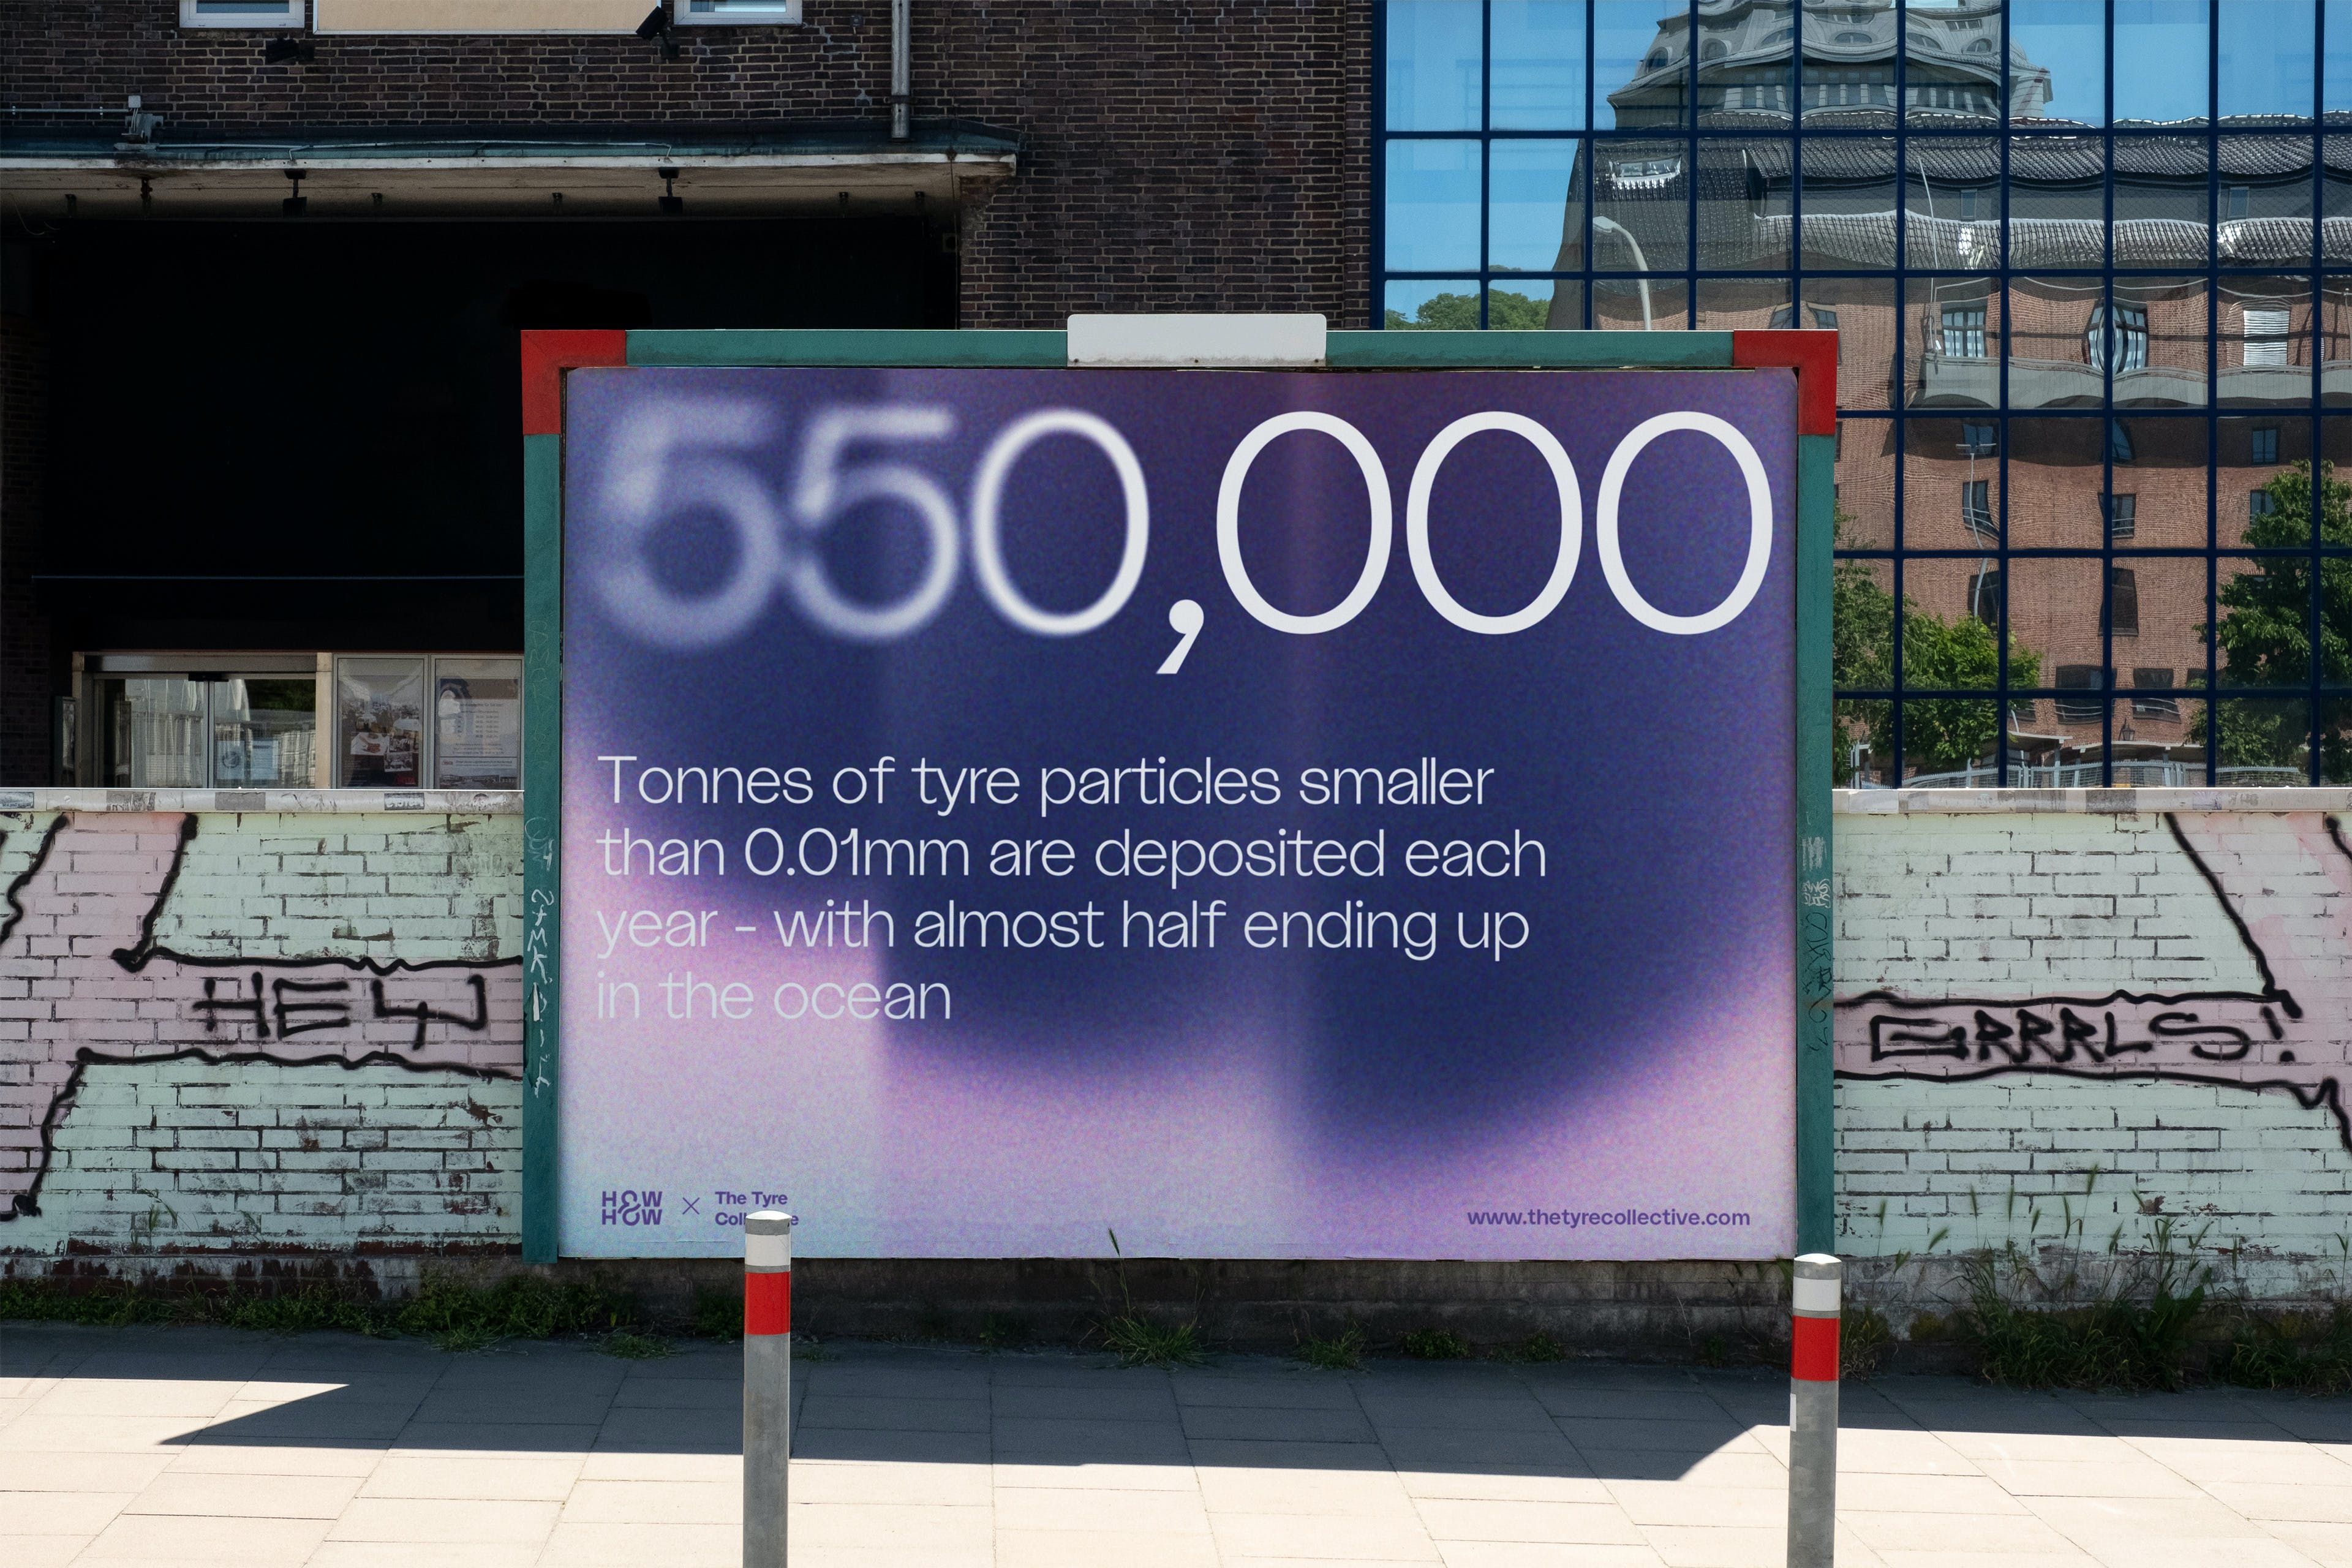
The image features a large, informational sign with bold statistics set against a muted background. The design is clean and direct, utilizing strong contrast between the white text and the deep purple/blue gradient to convey scientific or environmental data.
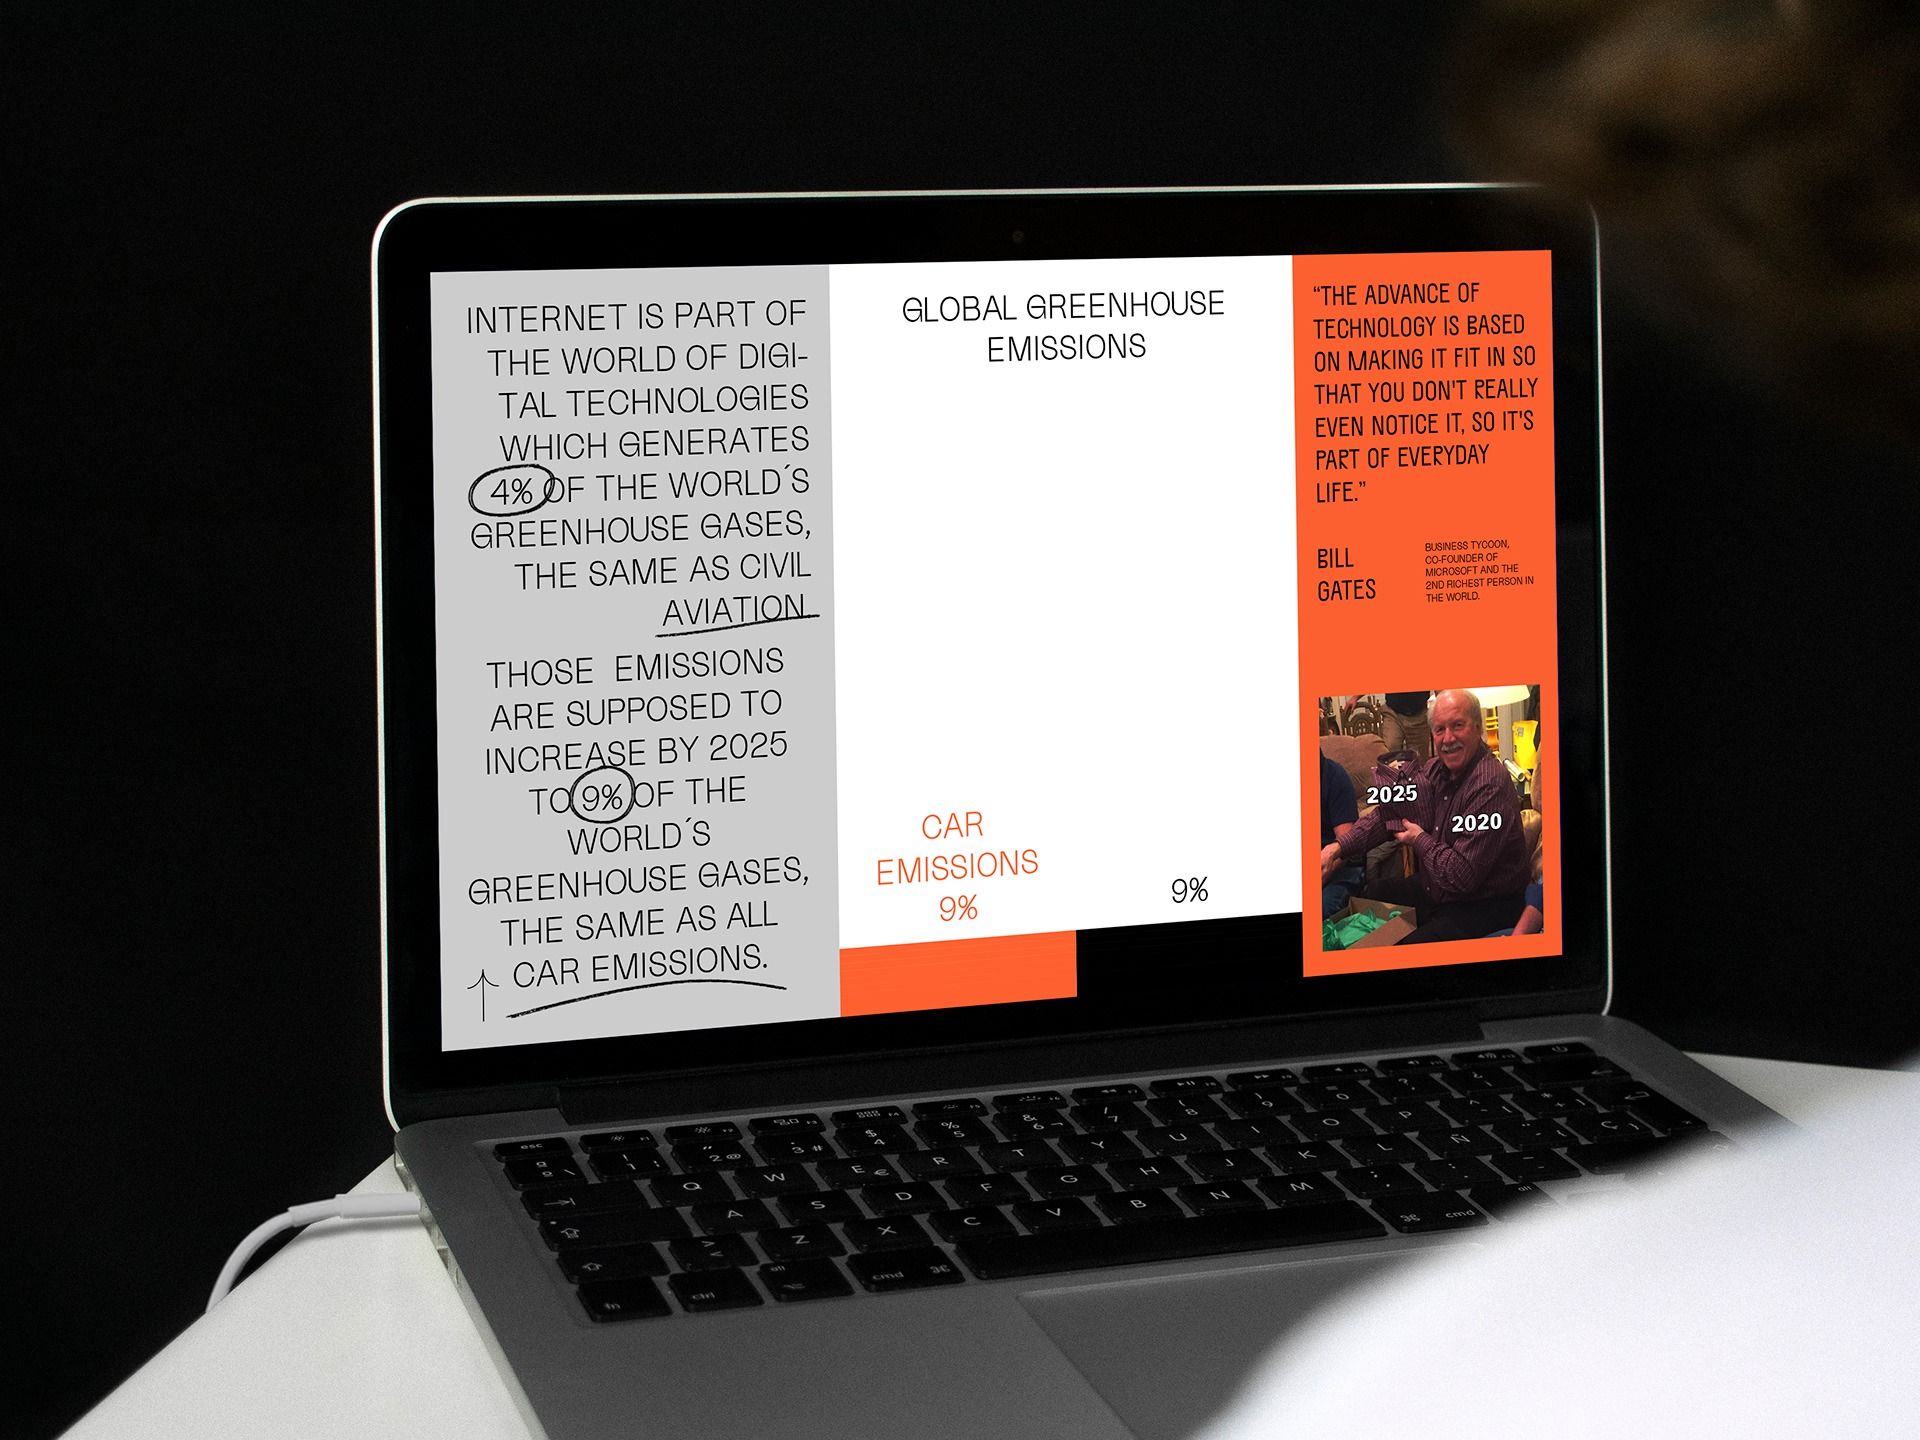
The image presents a clean, professional visual display on a laptop screen, likely an infographic or report summary. The design uses high contrast and clear segmentation to present data related to greenhouse gas emissions, conveying a serious and informative tone.
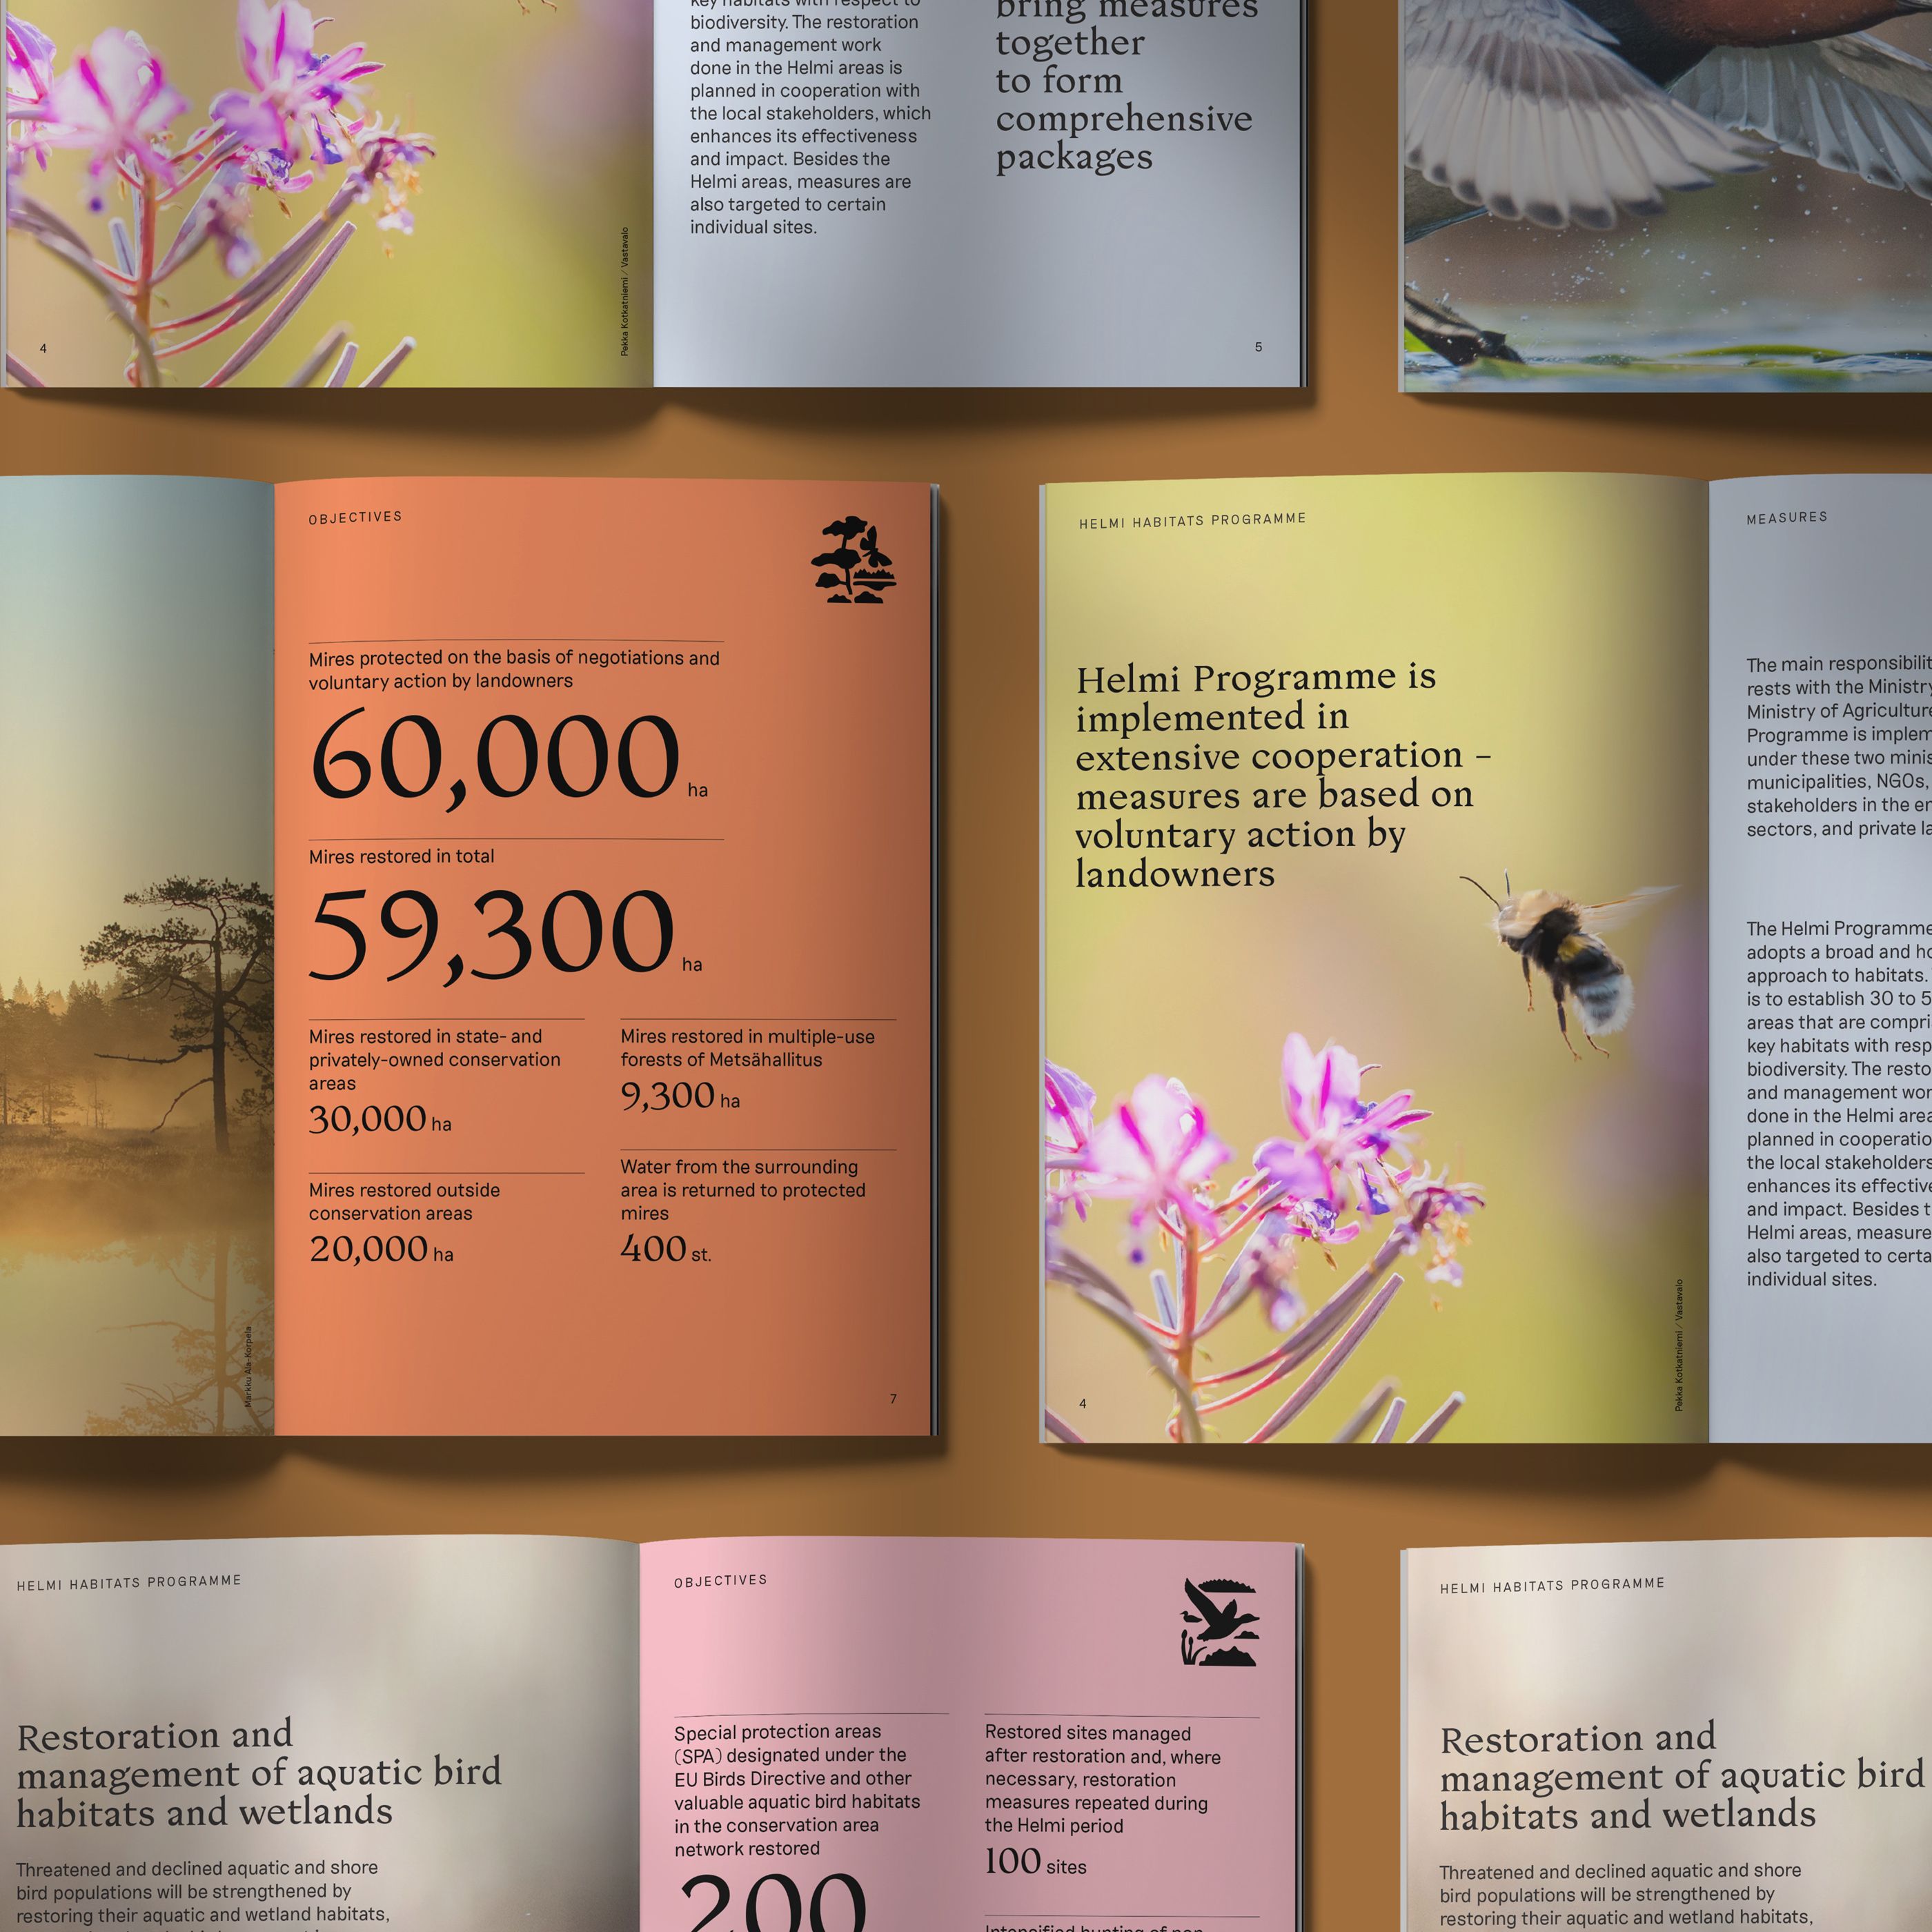
The image displays a series of informational or programmatic documents, likely reports or brochures, characterized by a clean, professional, and nature-focused design. It uses ample white space and high-quality photography to convey detailed environmental or conservation information.
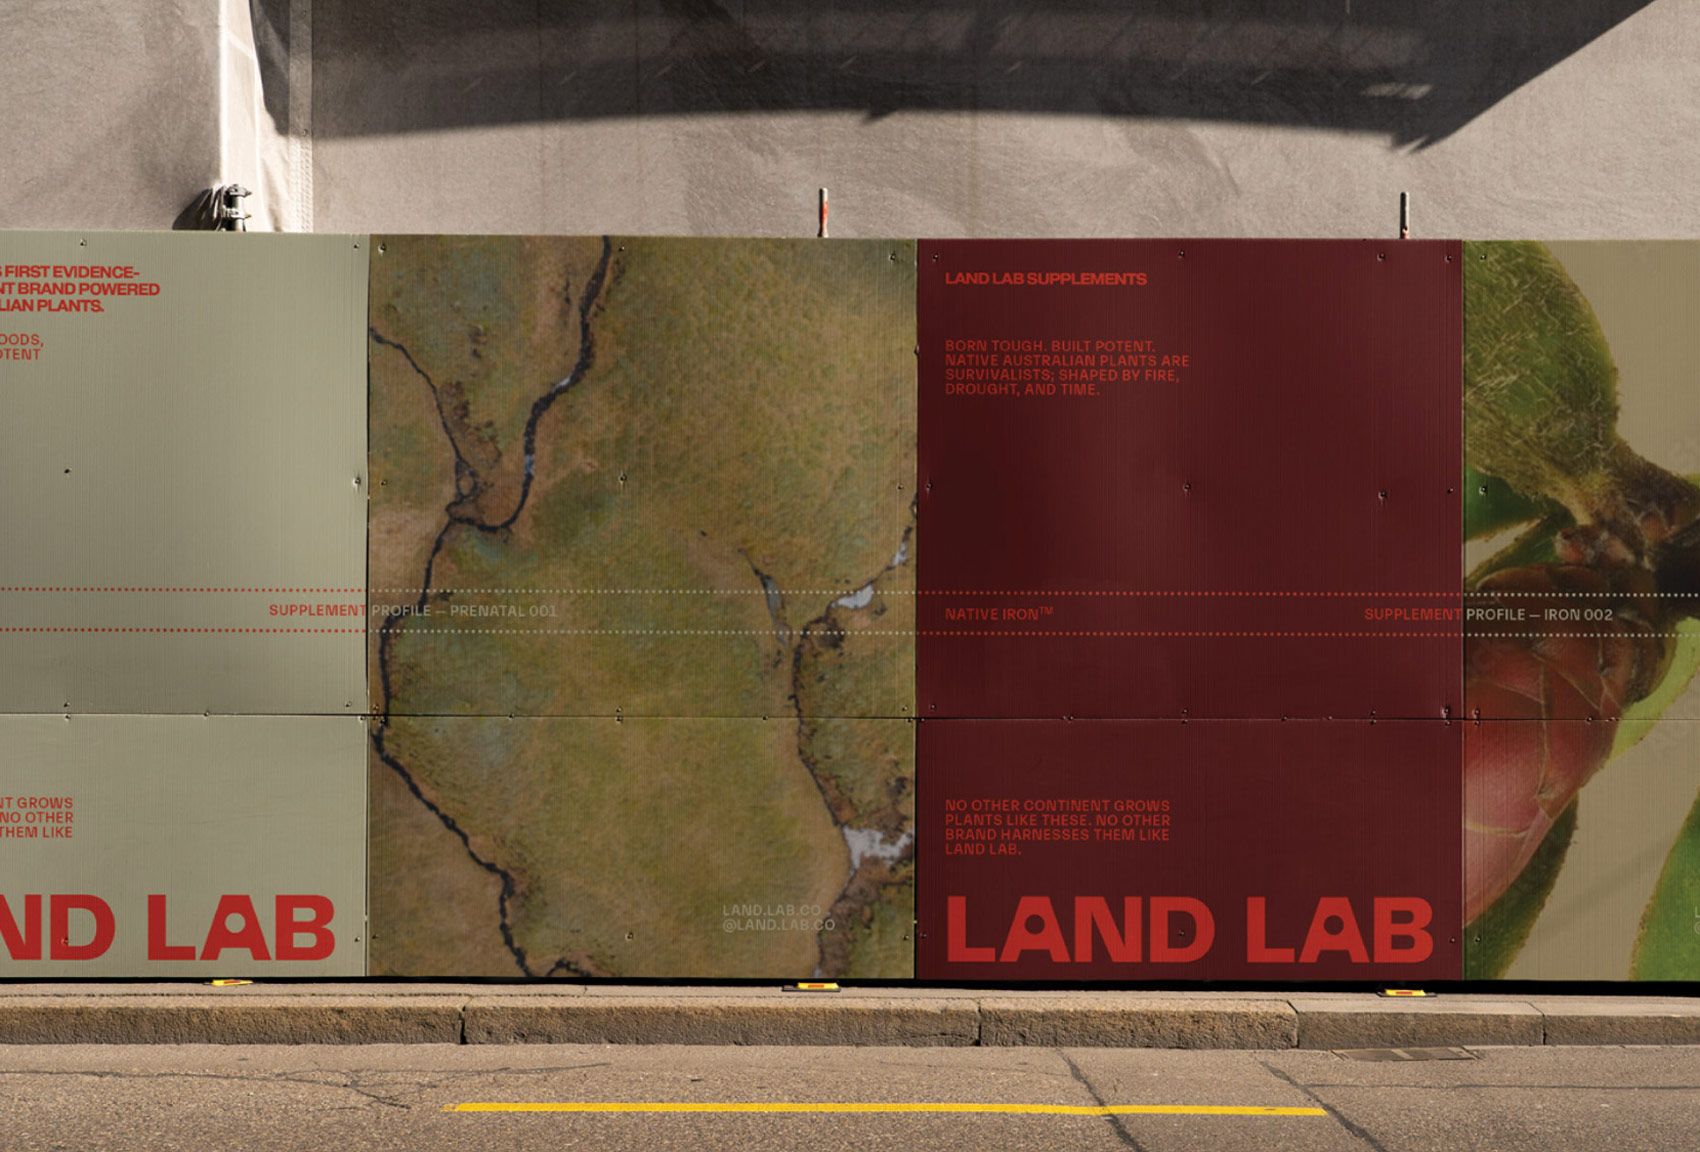
The image displays a modular, industrial facade featuring large panels with muted earth tones and subtle topographical map elements. The design emphasizes a clean, modern, and somewhat academic or scientific aesthetic through its structured layout and restrained color choices.
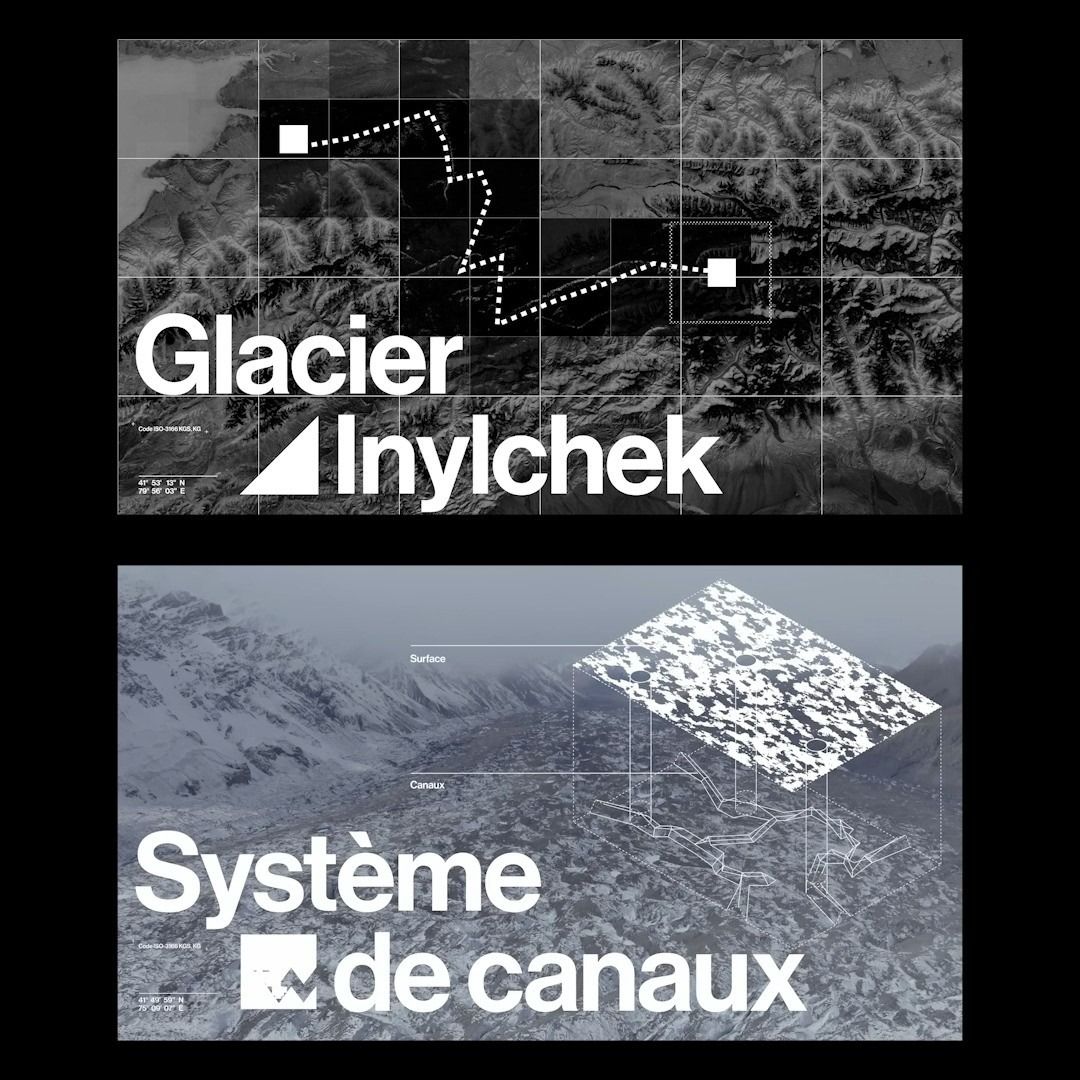
The image presents a stark, monochromatic map or topographical visualization focusing on glacial features and drainage systems. The design is clean, technical, and academic, relying heavily on line work and spatial representation to convey geological information.
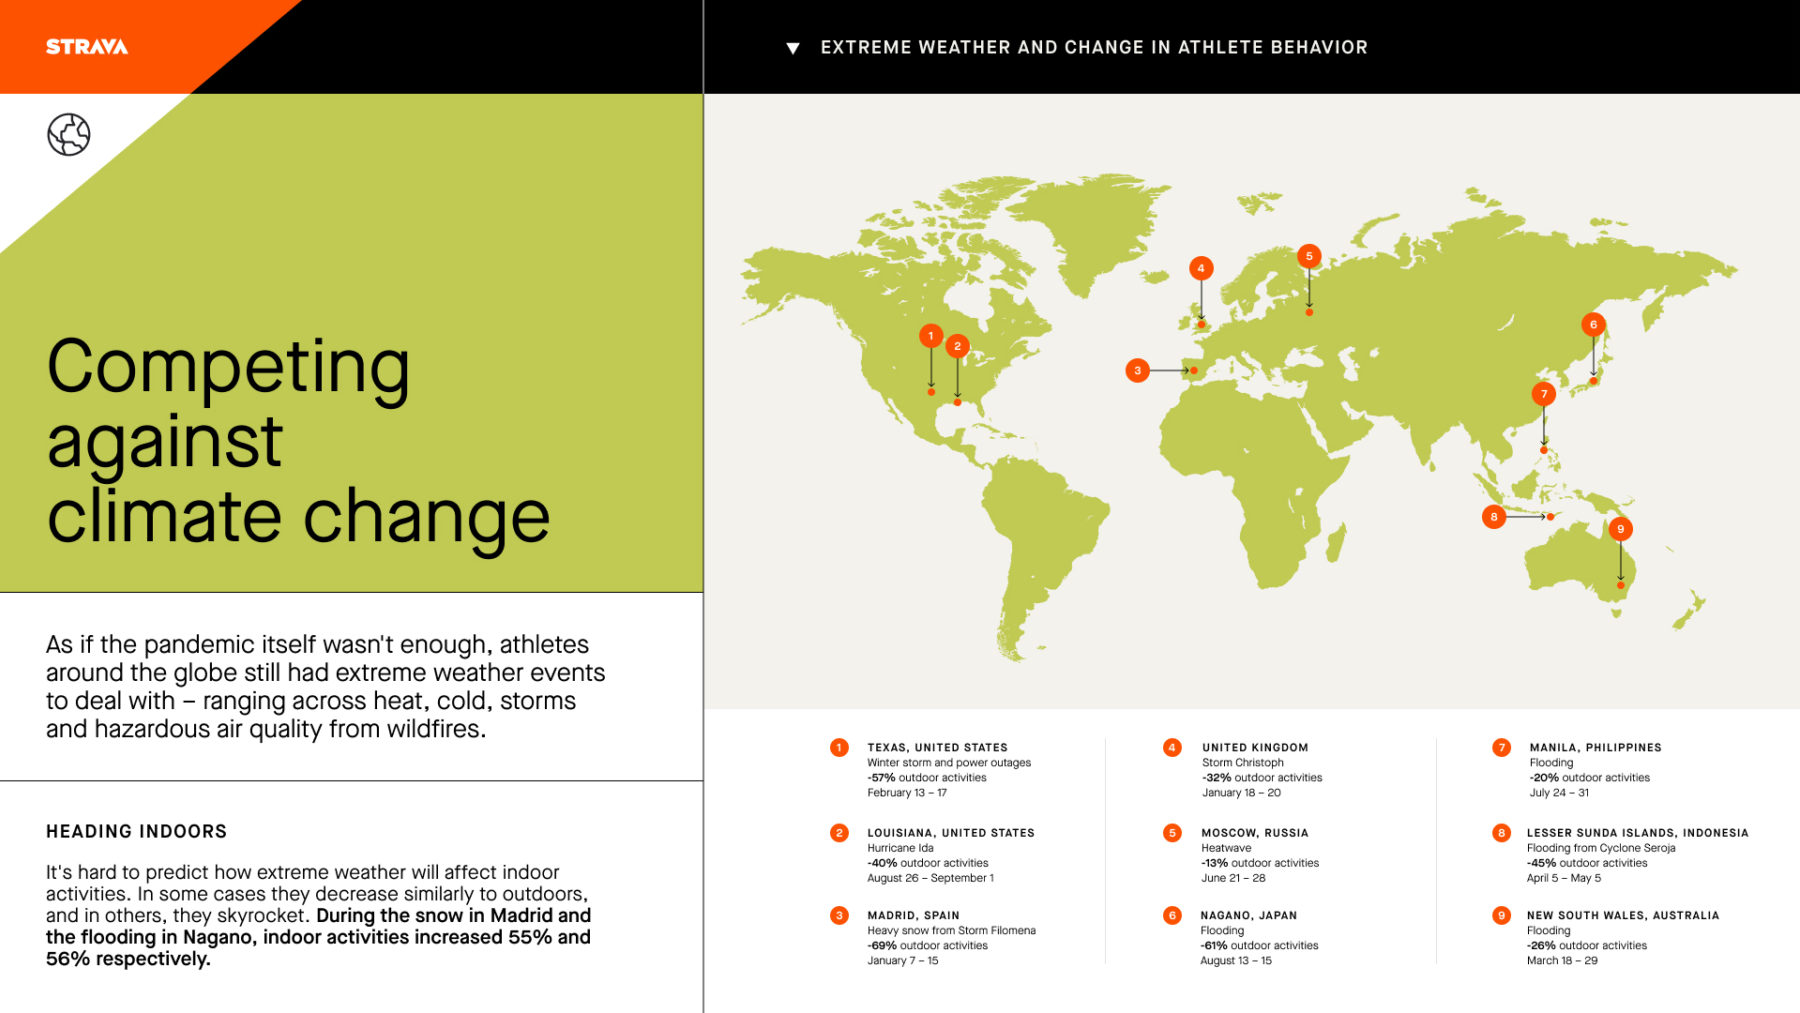
The design is clean, professional, and informative, utilizing a muted, earthy color palette to convey a serious topic related to climate change. The layout is dominated by a large map graphic, suggesting global scope and data visualization.
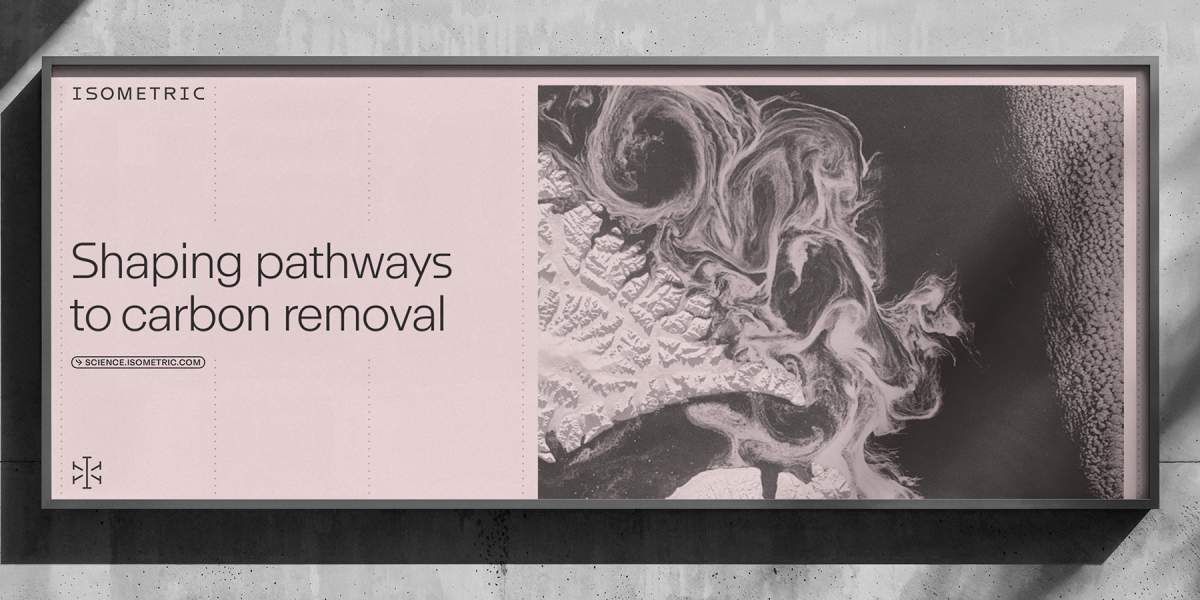
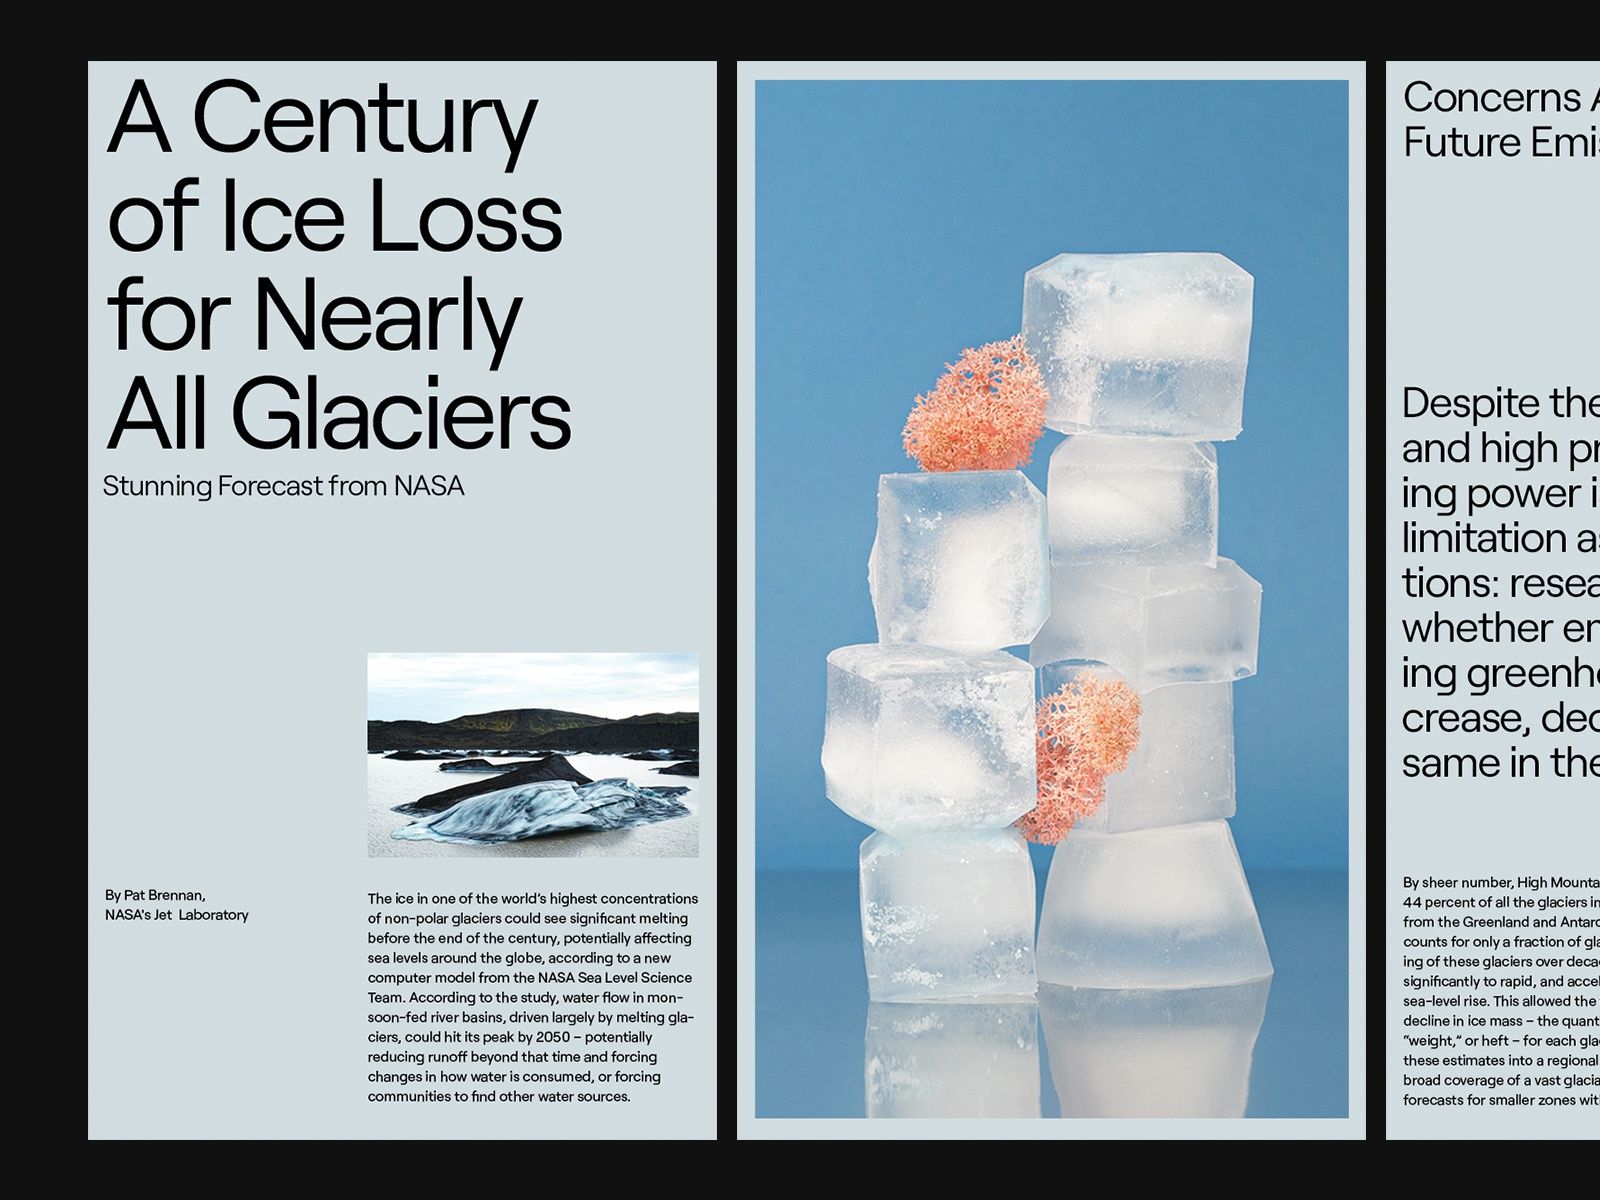
This is a clean, professional graphic design piece utilizing a minimalist layout to convey a serious scientific or environmental theme. The composition balances stark black and white imagery with soft, muted pink tones to create a sophisticated yet impactful visual narrative.
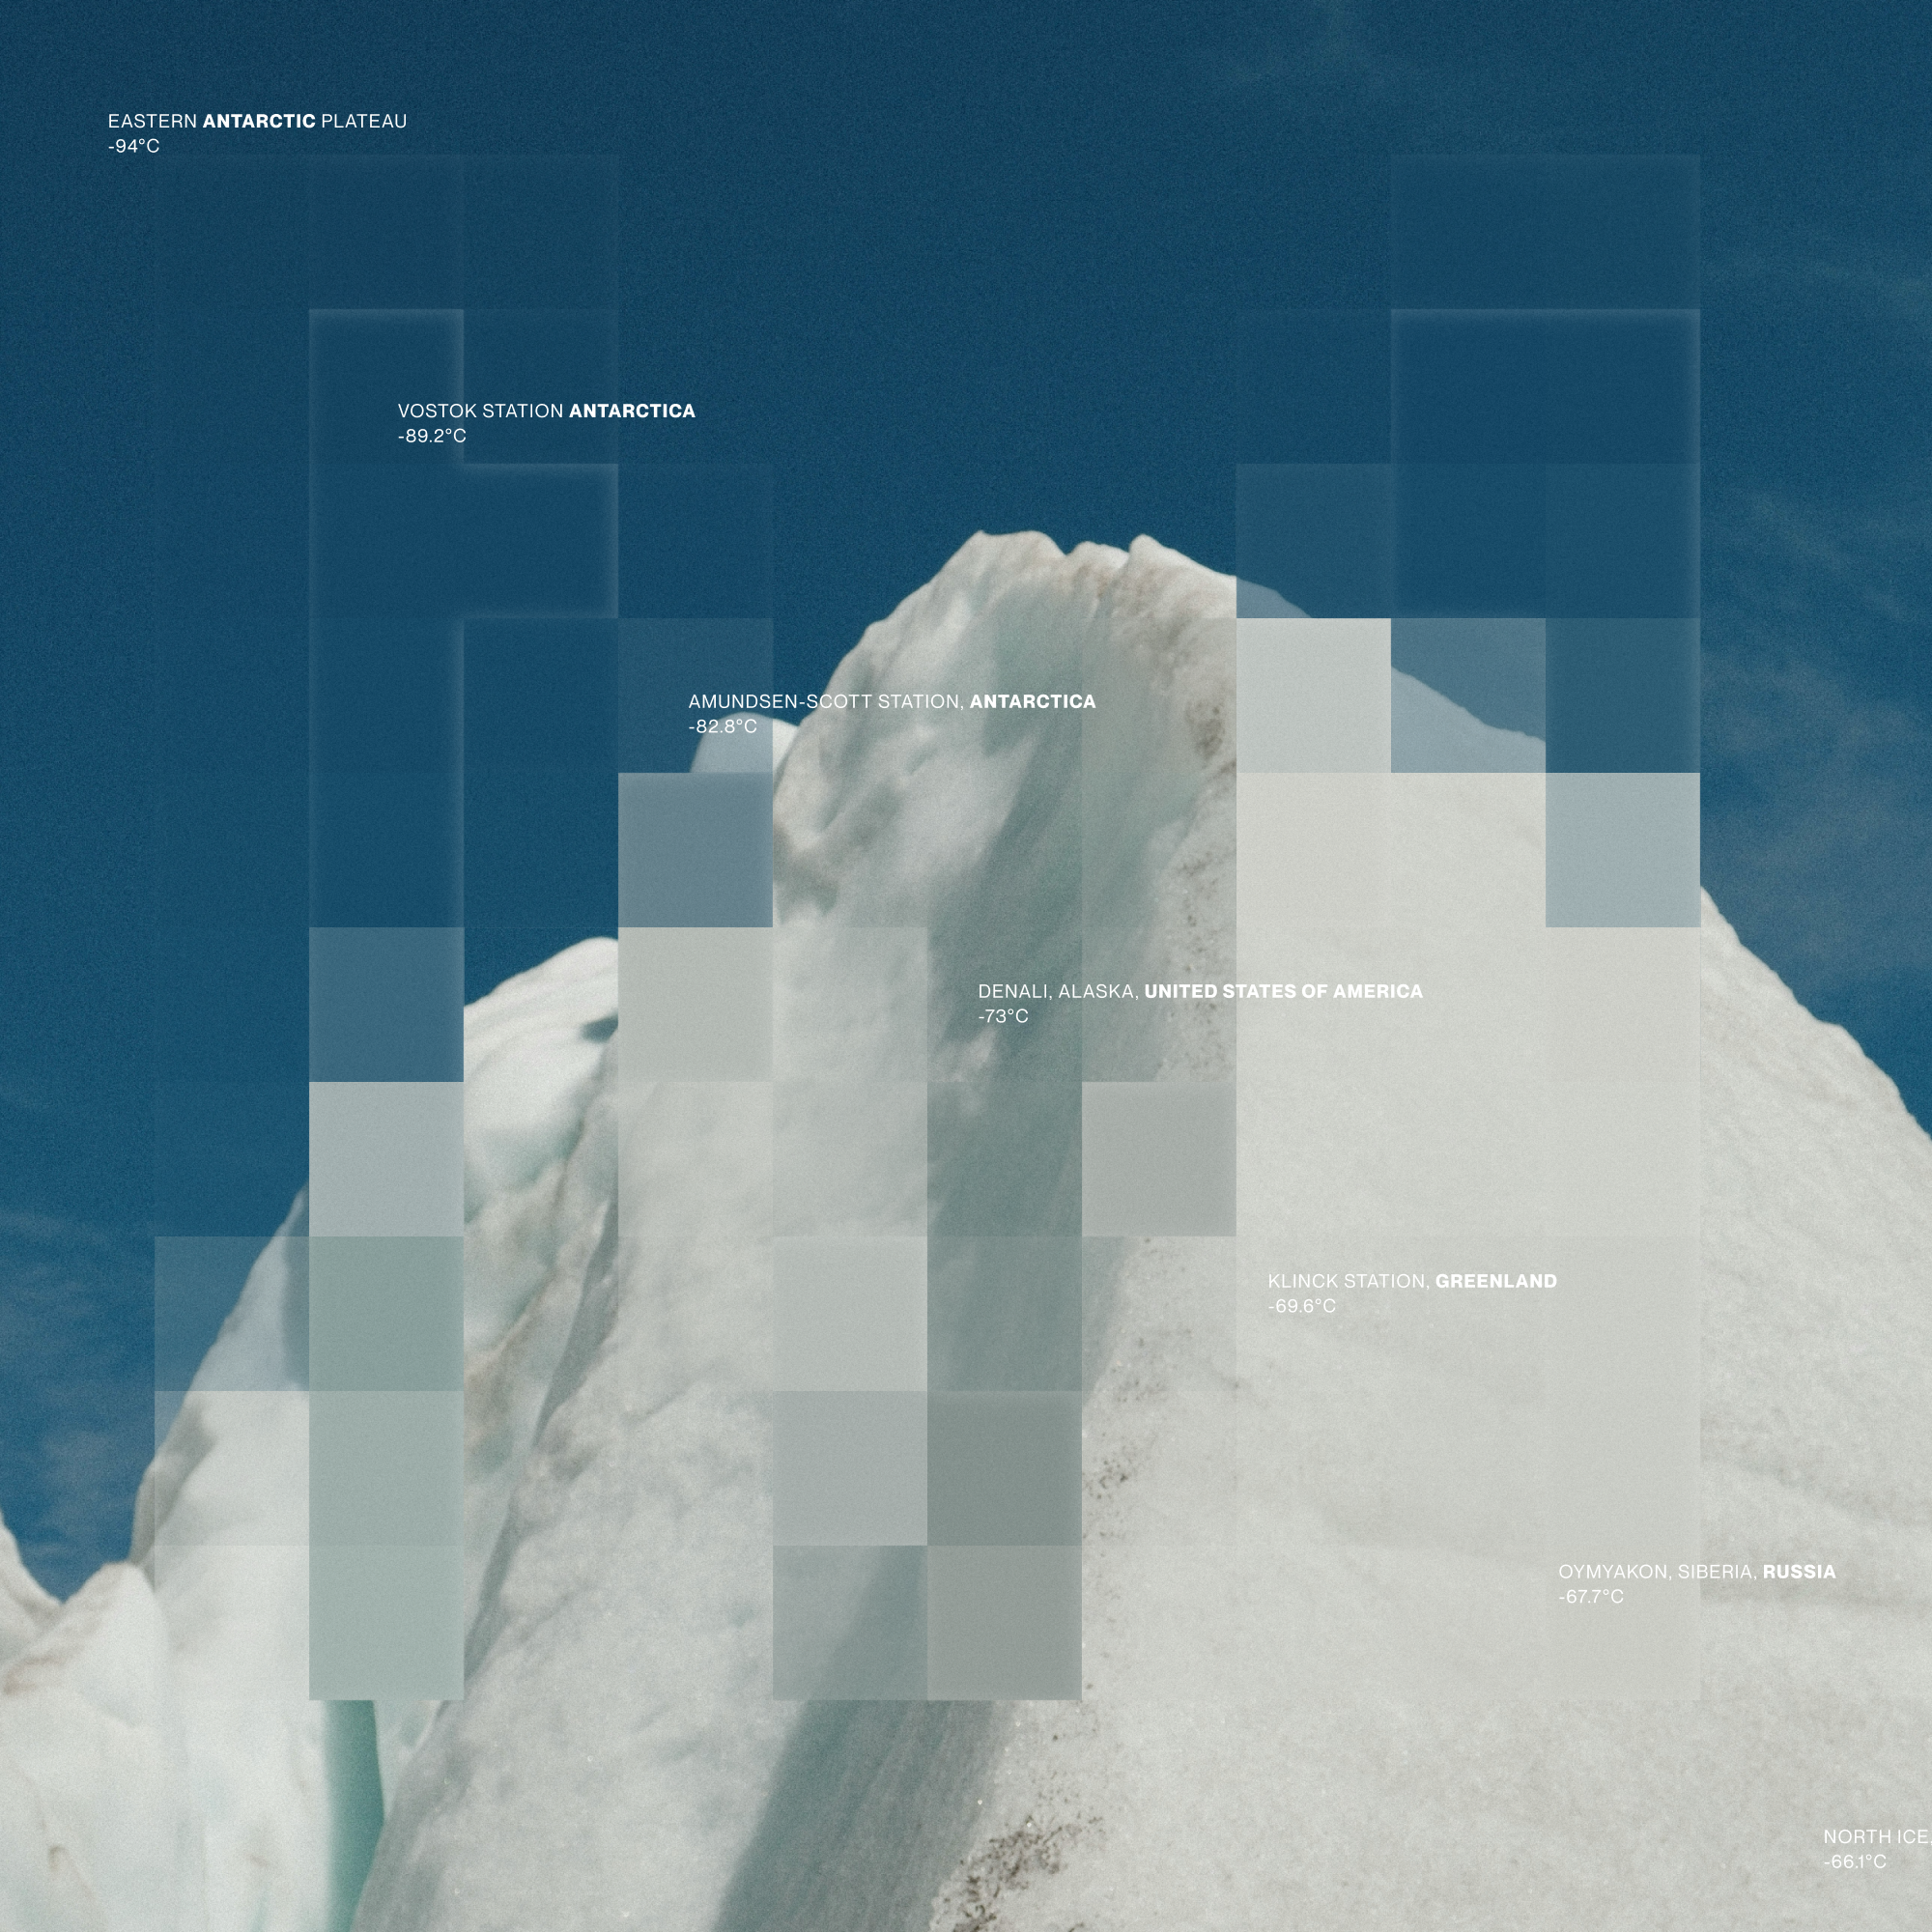
This image presents a stark, high-contrast visual study of glacial formations and scientific data points. The design utilizes a muted, cool color palette to evoke a sense of extreme cold and scientific exploration, resulting in a clean yet imposing aesthetic.
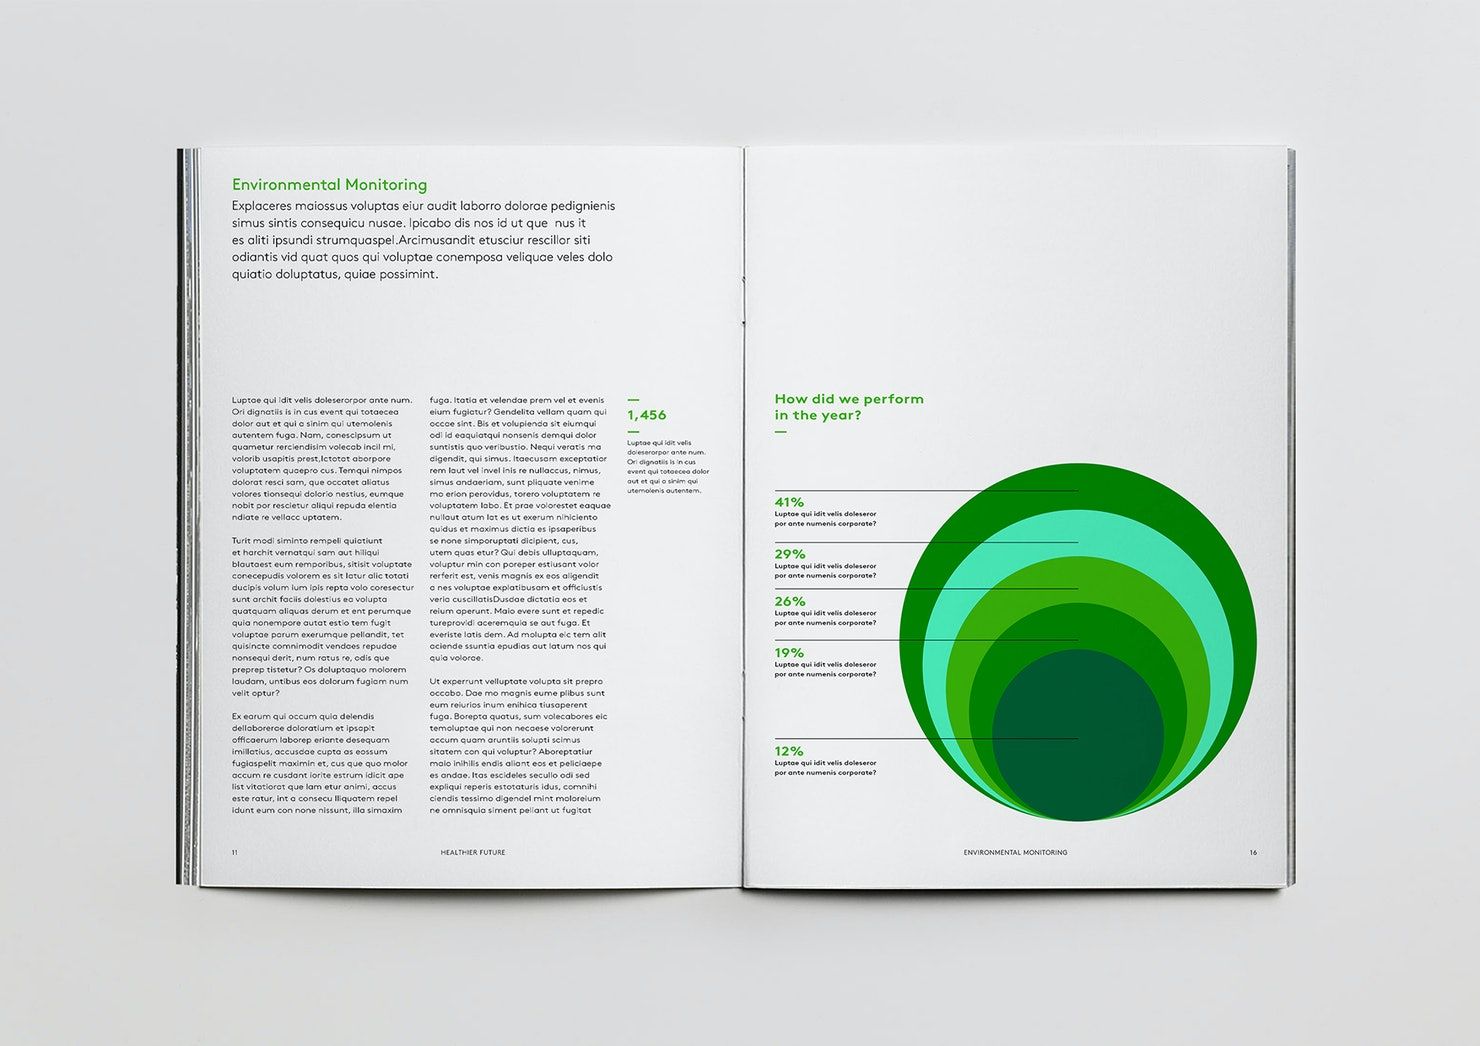
The image displays a clean, professional, and data-driven layout typical of an environmental monitoring report or annual review. It uses a strong visual hierarchy with clear sections and a modern, nature-inspired color palette to present quantitative information effectively.
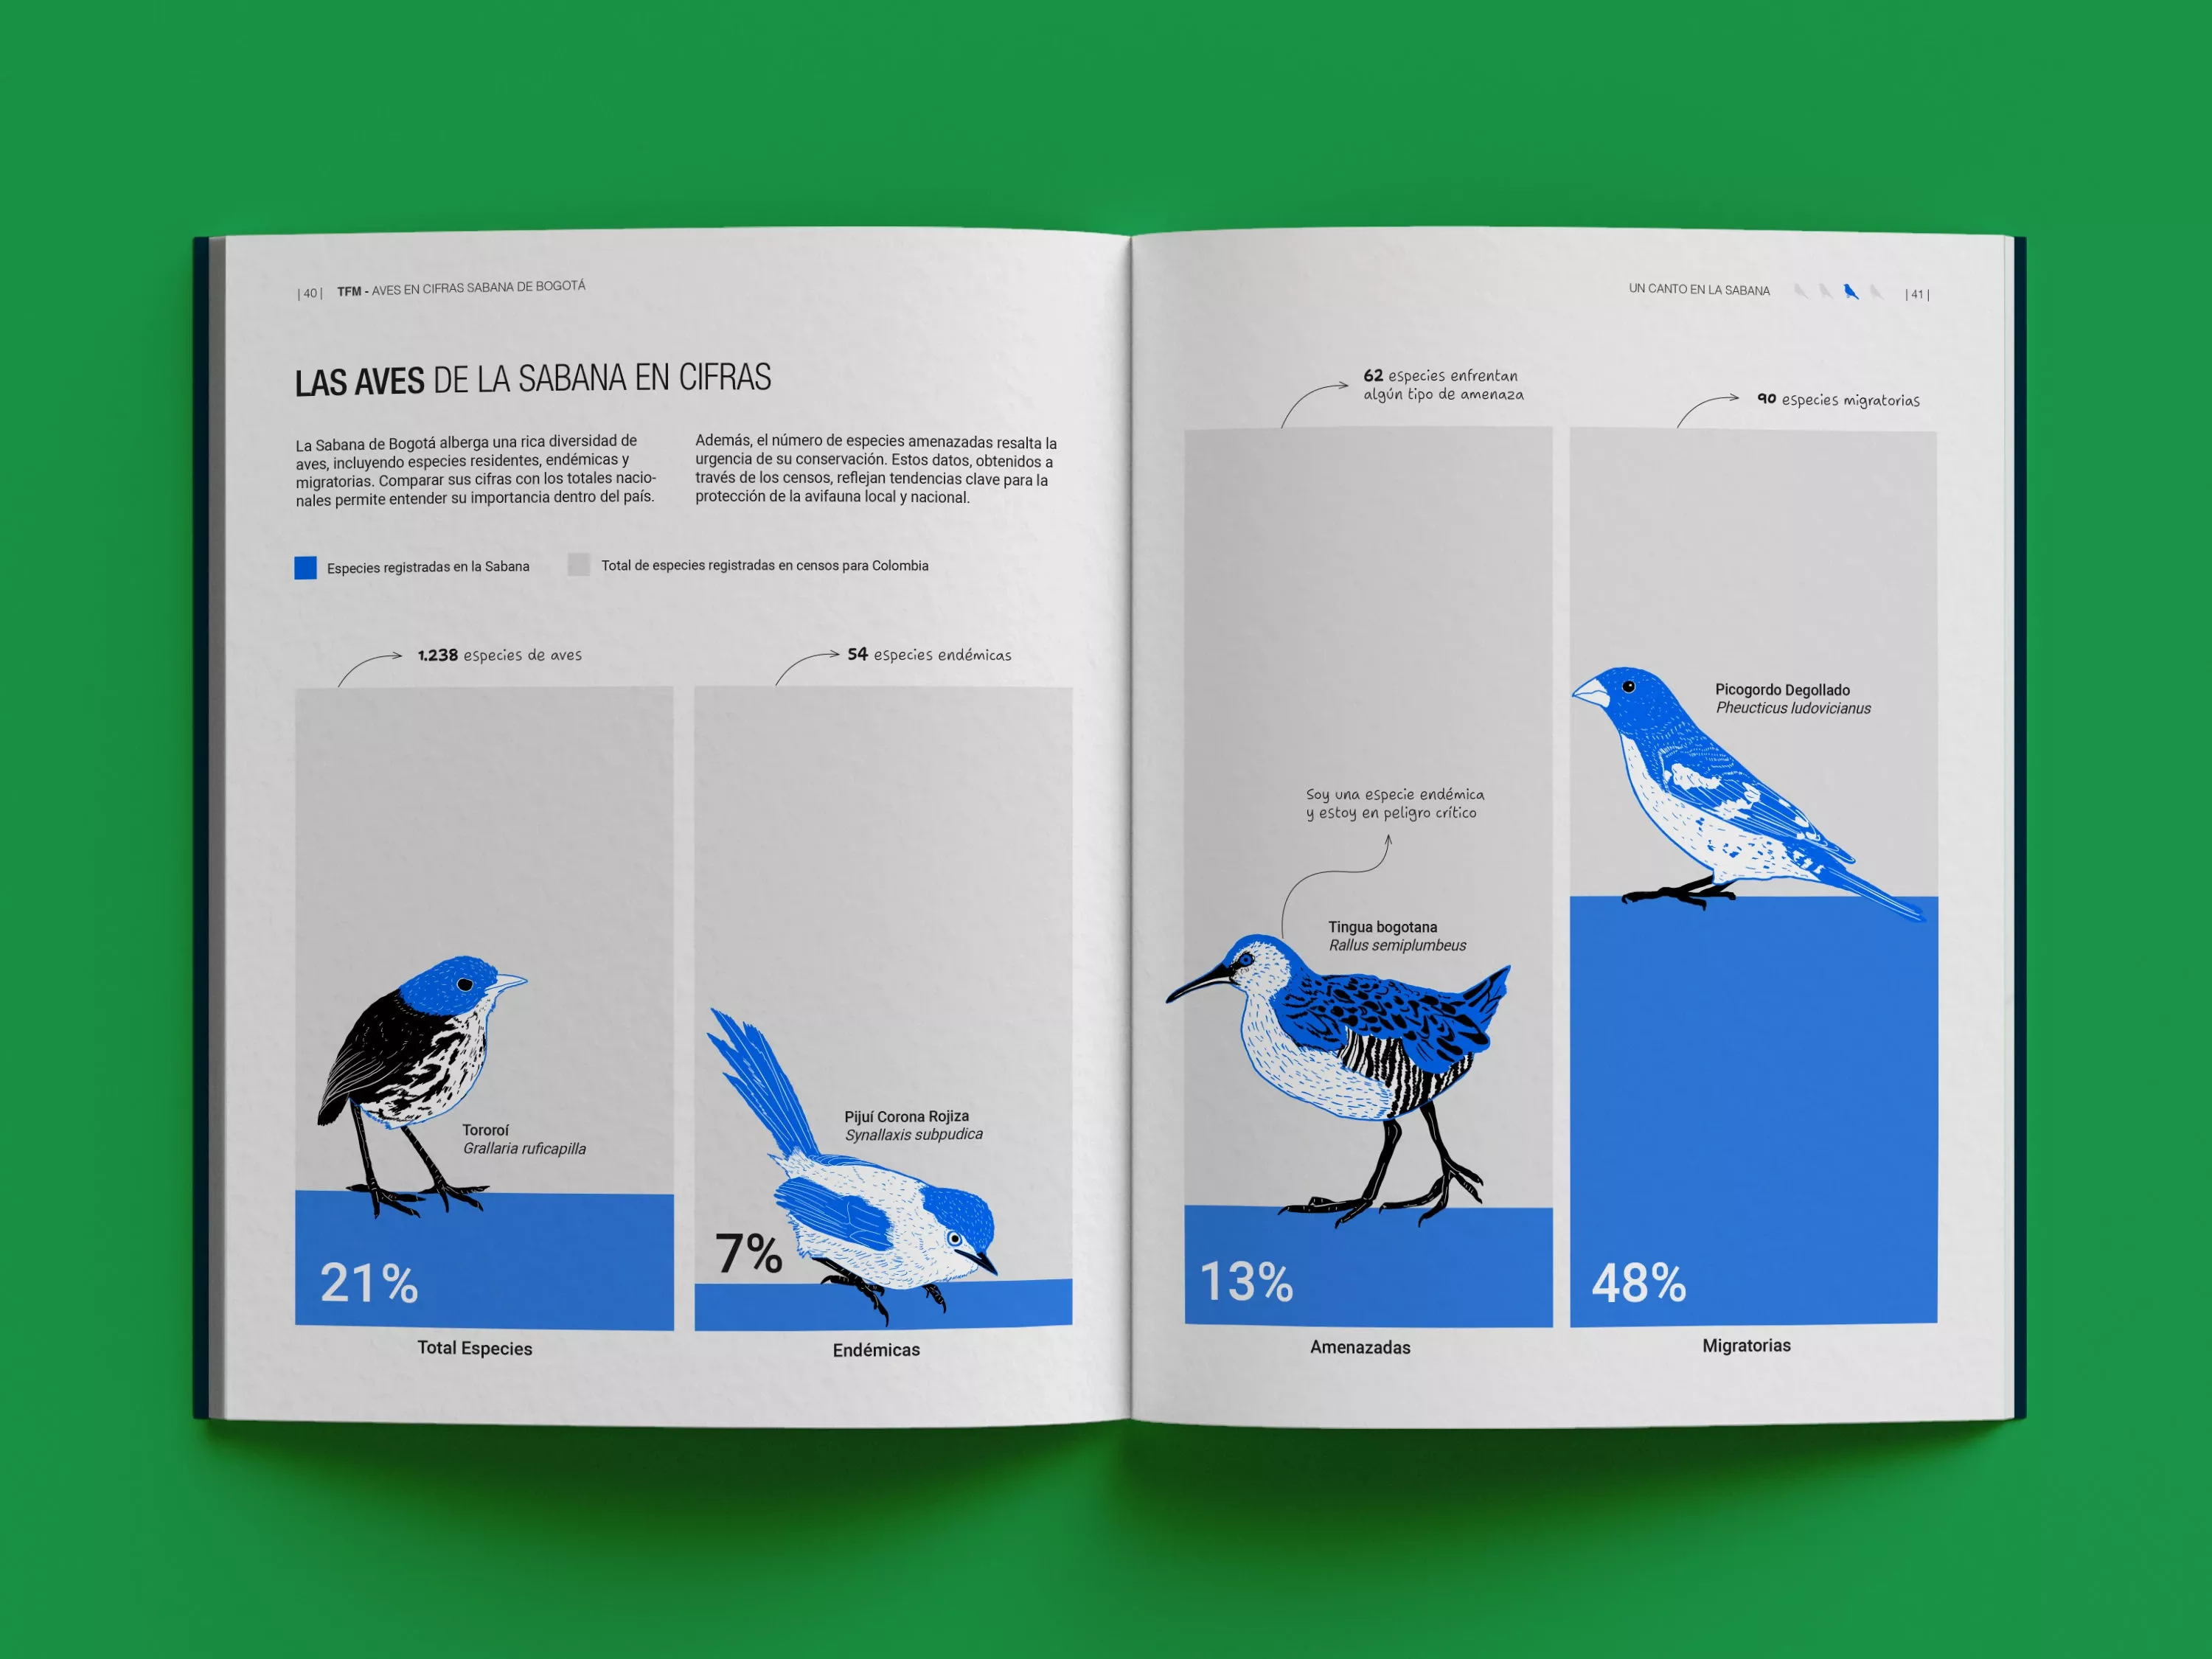
The image presents a clean, informative, and modern infographic spread detailing bird species distribution. It uses a clear hierarchy of data visualization, combining icons/illustrations with percentage callouts against a muted background.
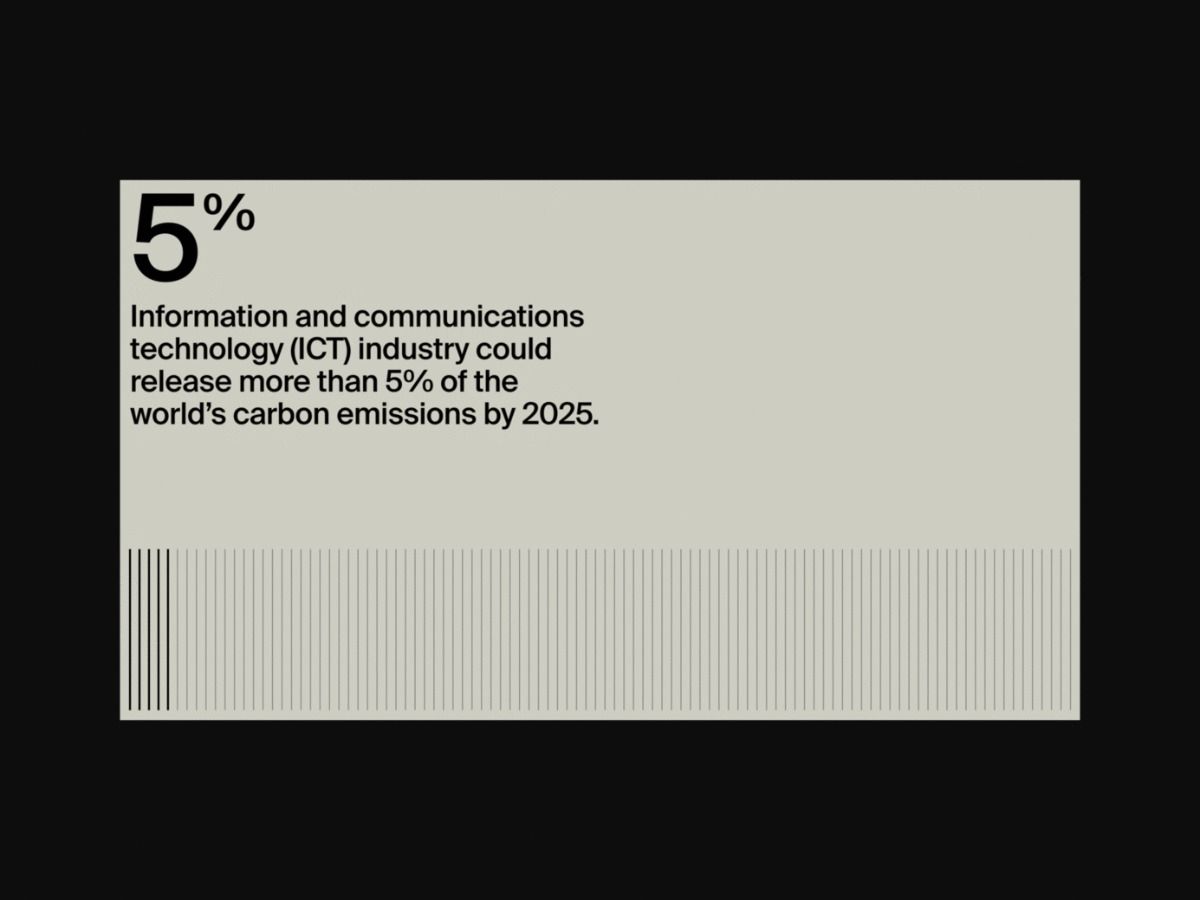
The image presents a stark, minimalist data visualization or infographic style, using a muted, monochromatic palette to convey a serious, factual message. The design relies heavily on negative space and simple typography to present a specific projection regarding carbon emissions.
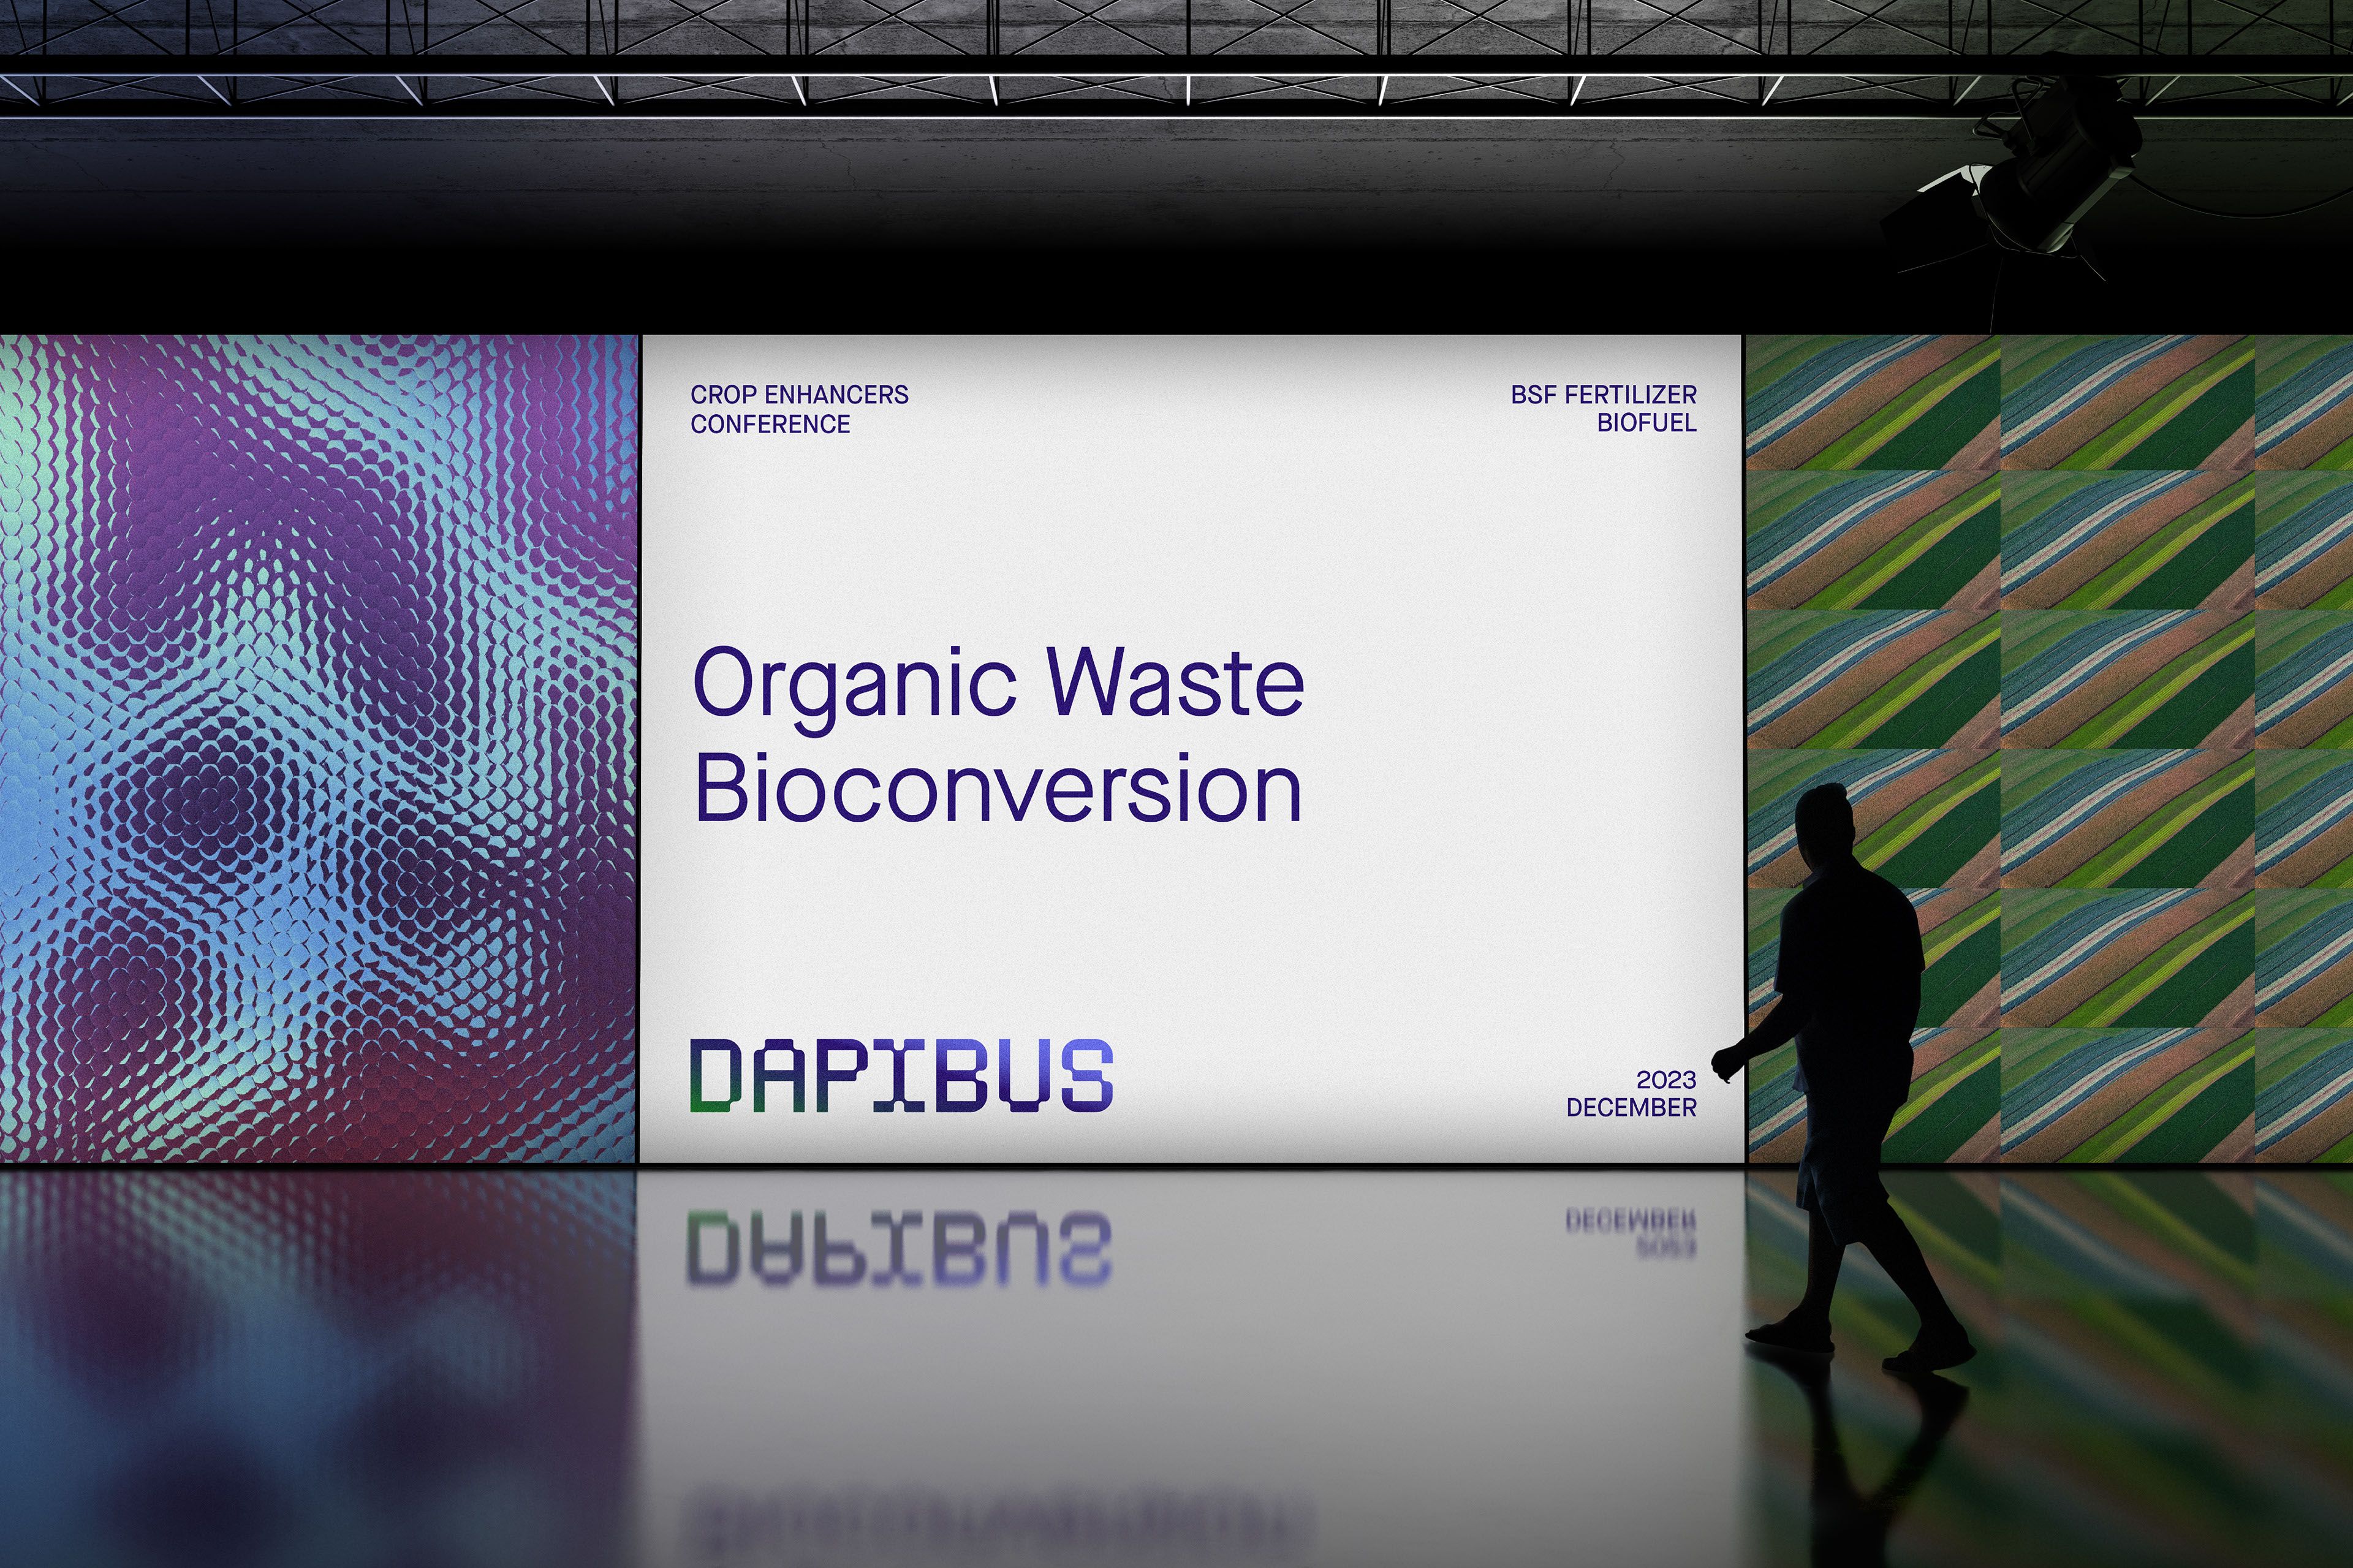
This is a high-production presentation graphic utilizing smooth gradients and clean typography set against a dark, industrial backdrop. The design effectively balances corporate professionalism with themes of sustainable science and innovation through its clear visual hierarchy.
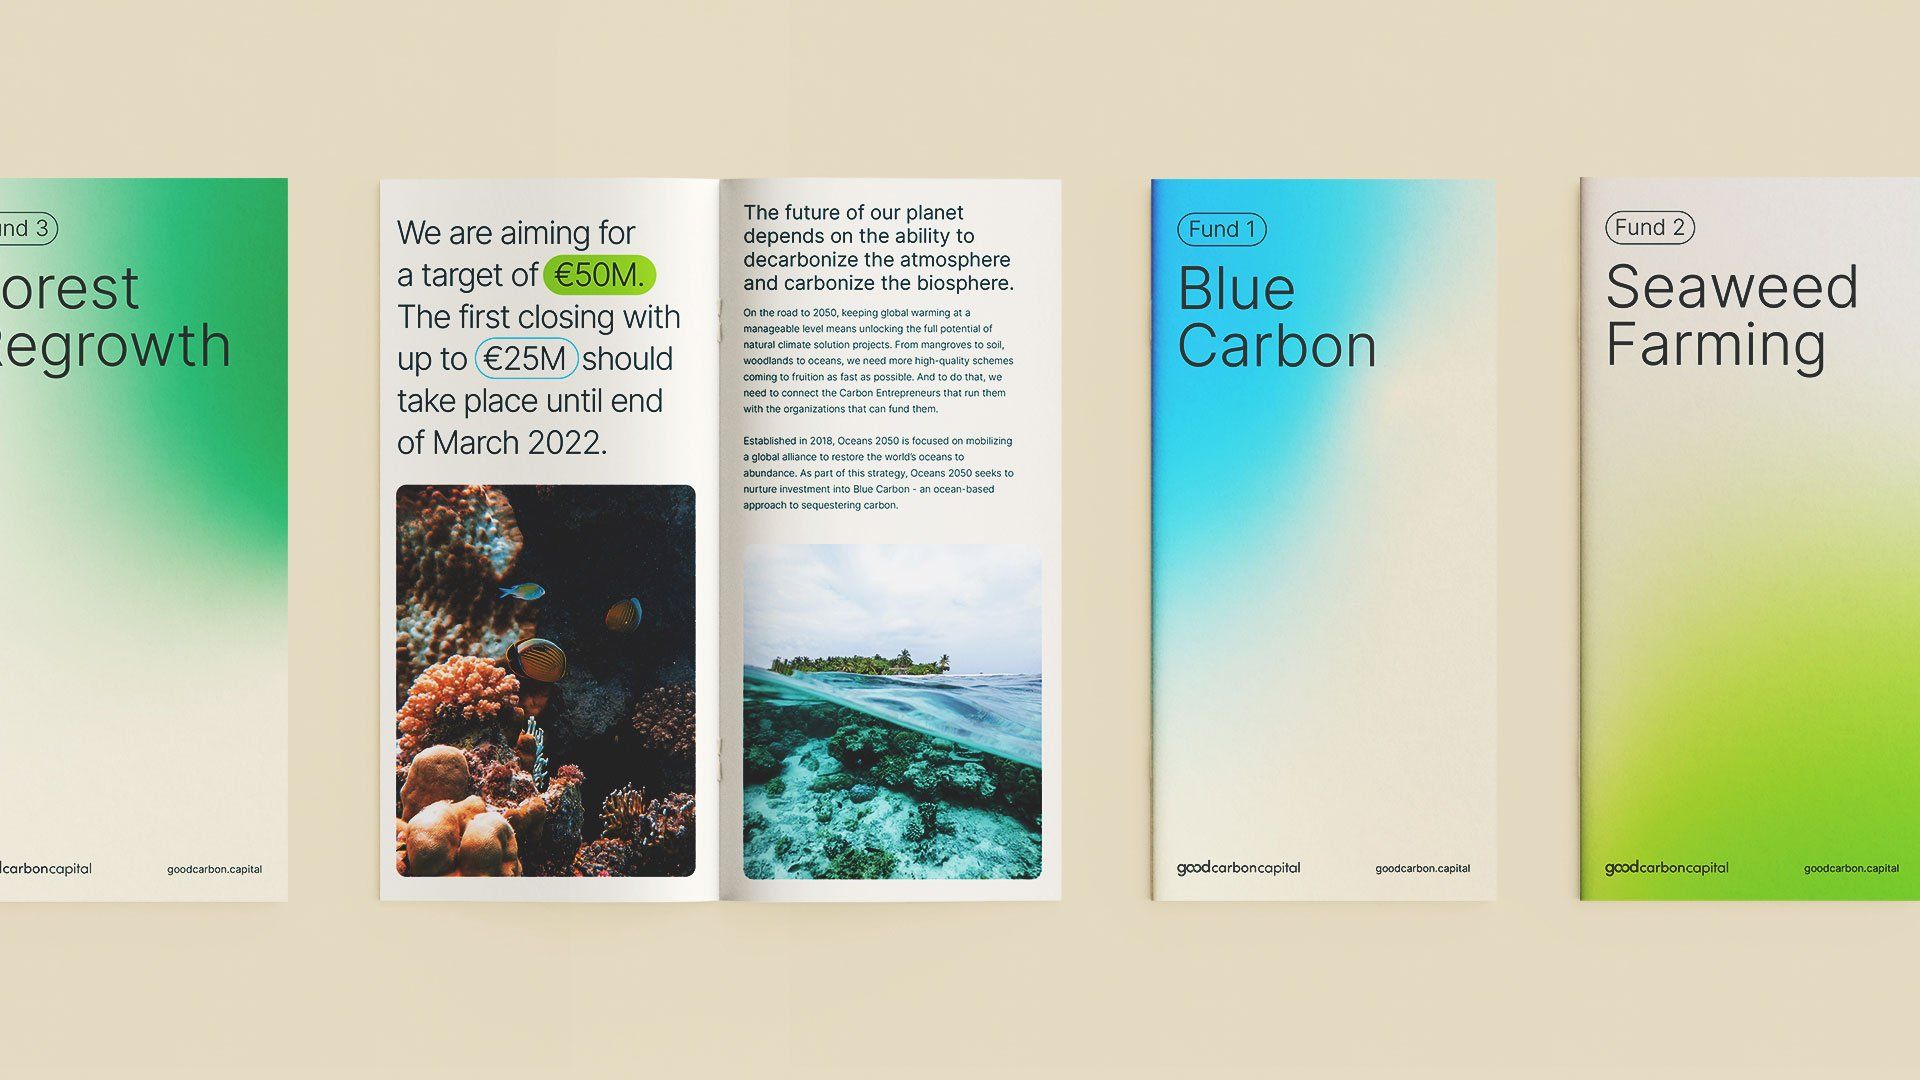
This design utilizes a clean, modular layout to present complex information regarding environmental funding opportunities. The visual language is modern and sophisticated, successfully blending scientific concepts (like blue carbon) with organic imagery to convey trust and innovation.
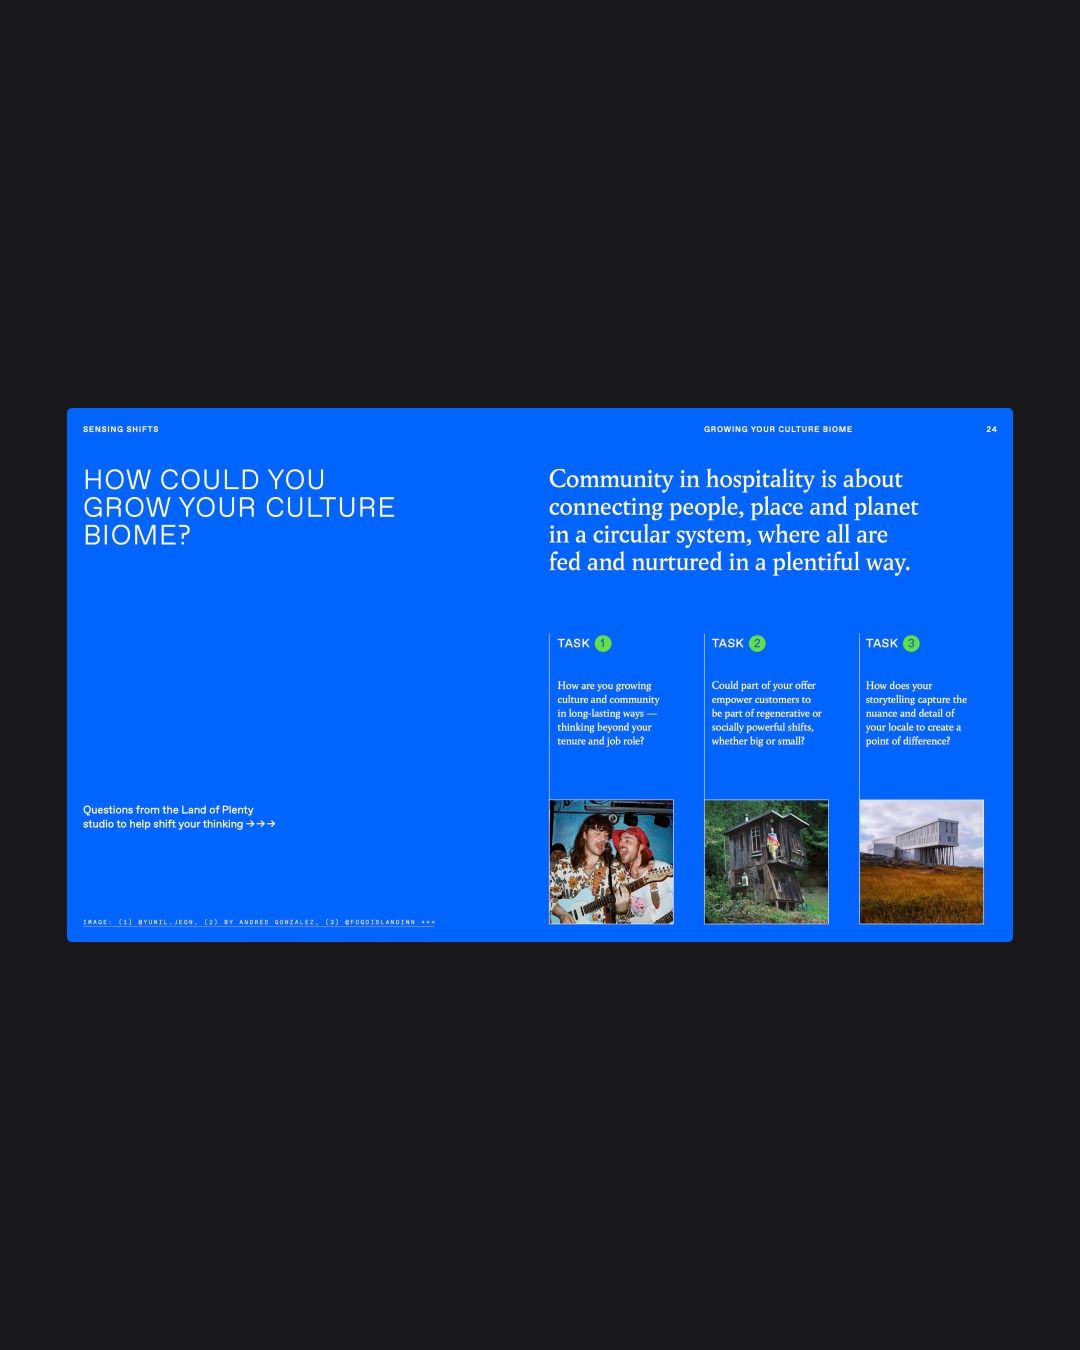
This slide utilizes a clean, professional design pairing dark backgrounds with light text to present complex information in an organized manner. The visual language is grounded in organic imagery, suggesting a connection between human systems and natural ecosystems. The overall feel is academic, thoughtful, and environmentally conscious.
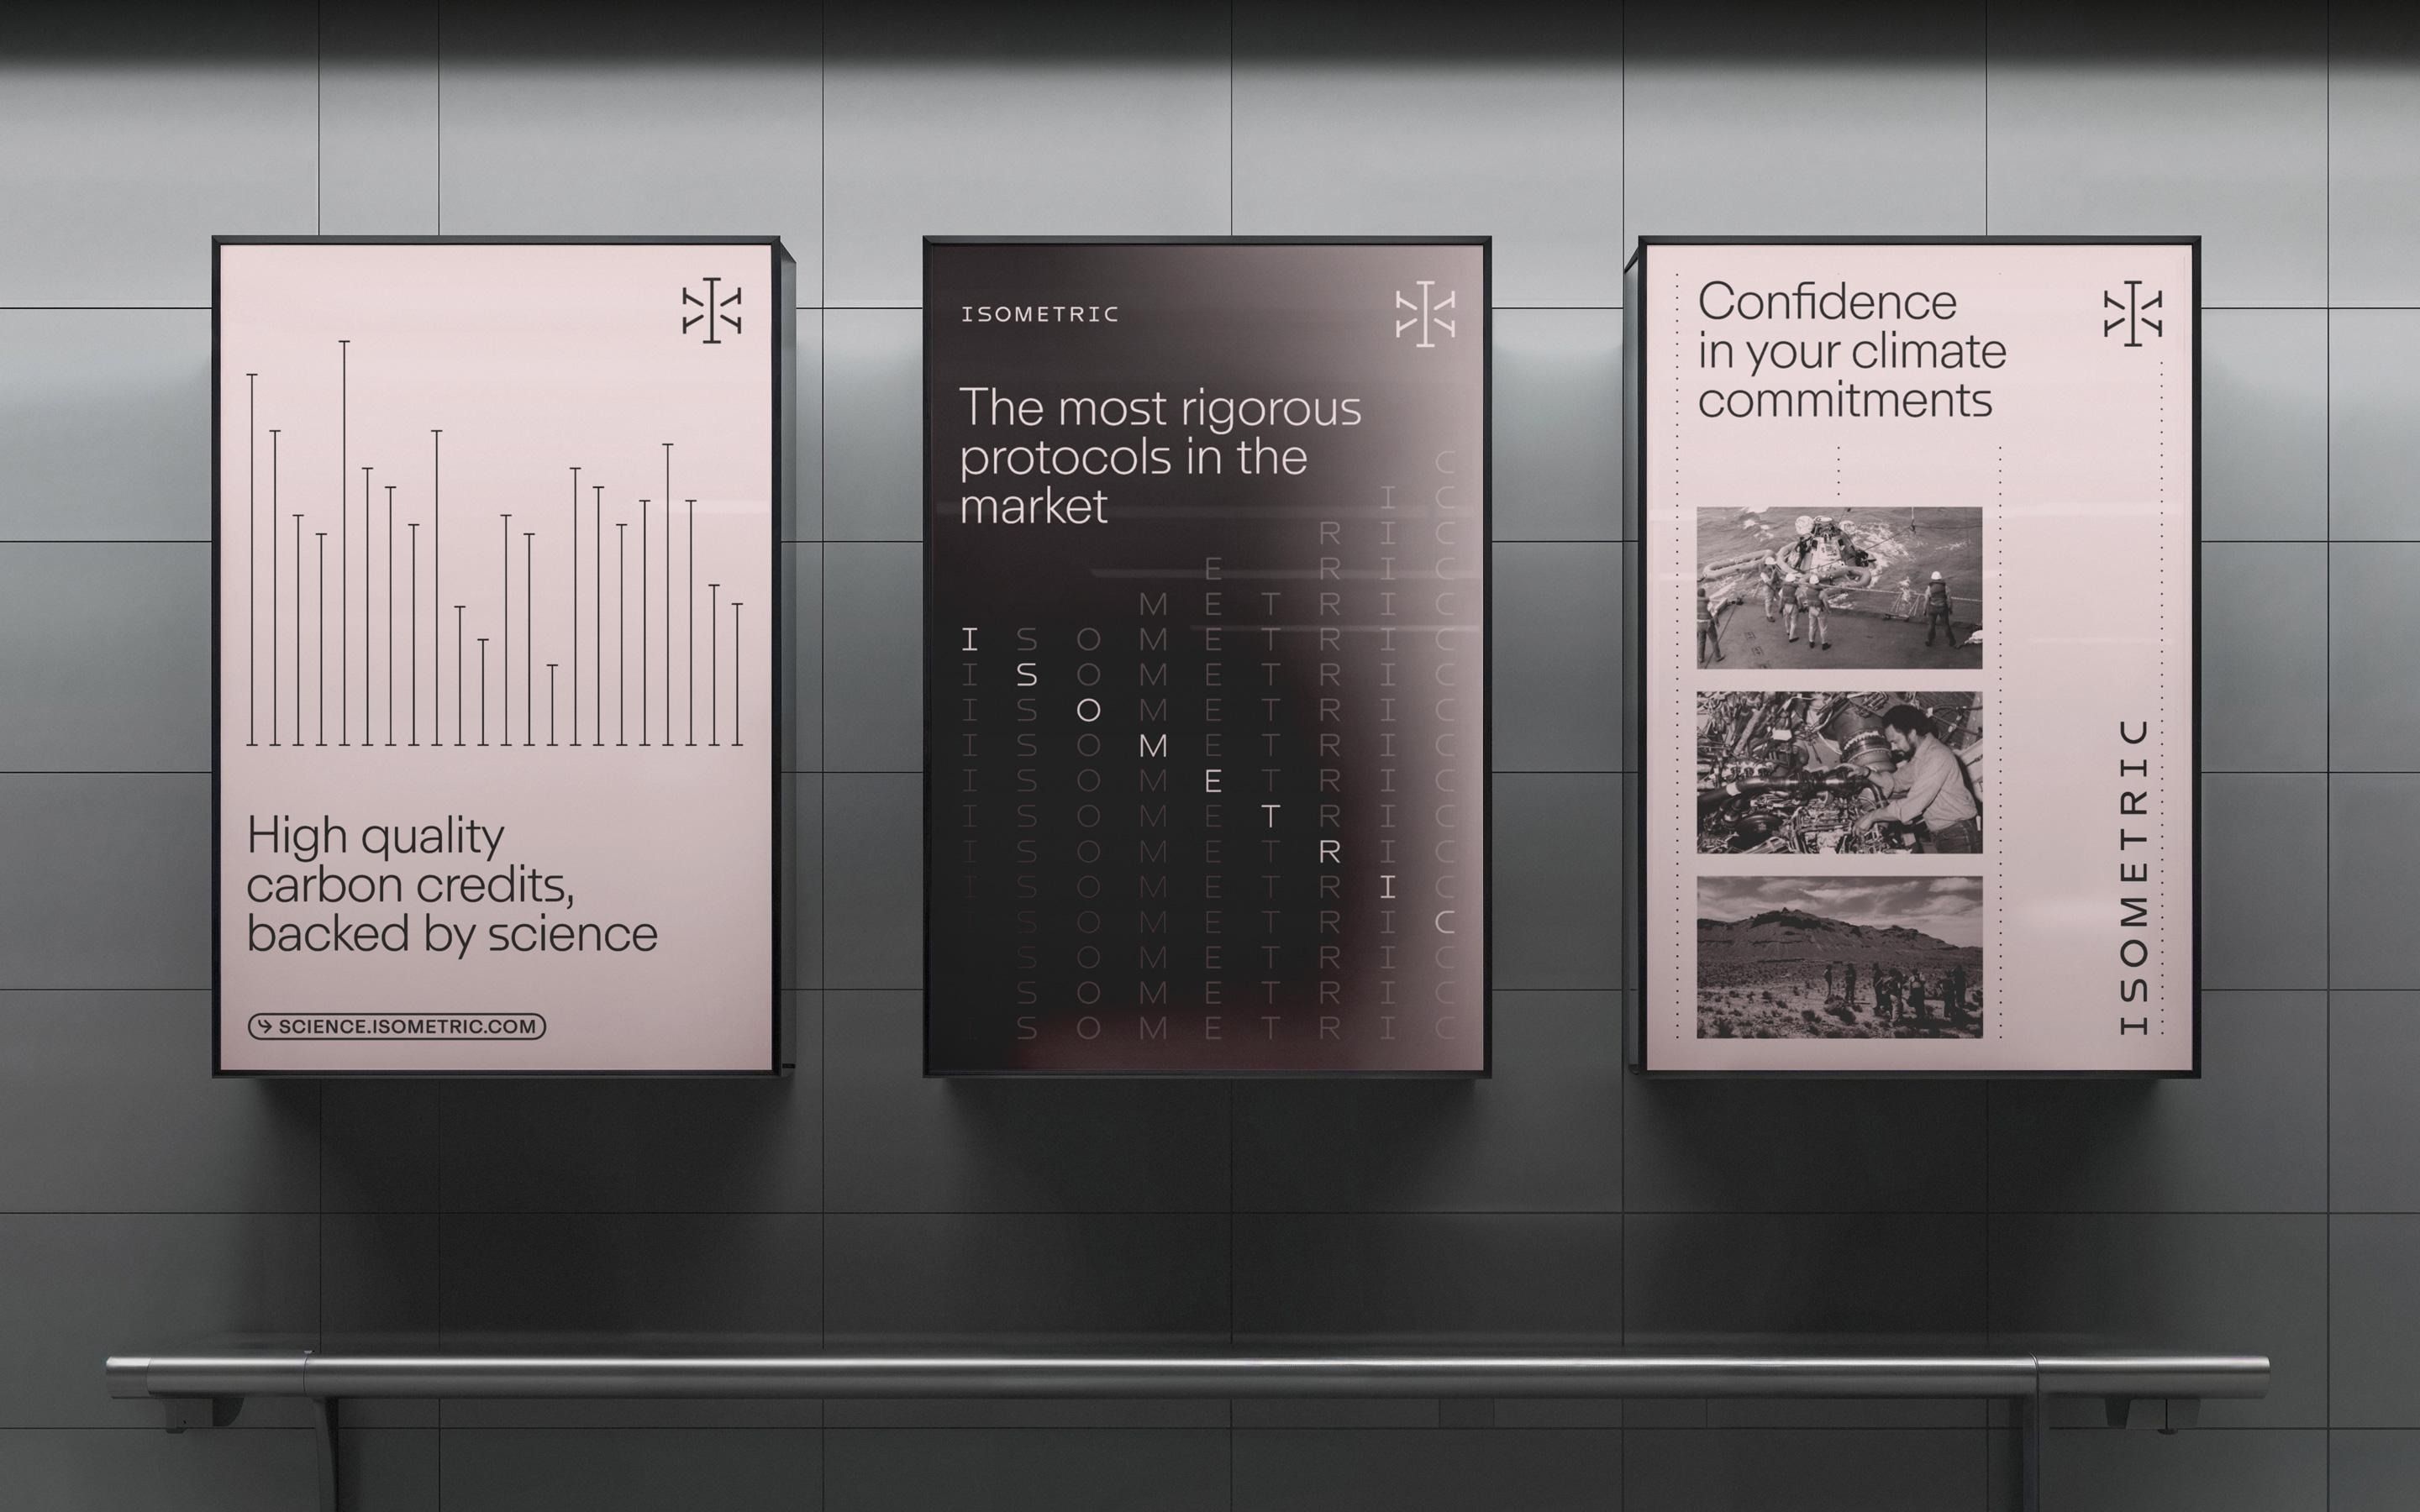
This set of panels utilizes a clean, highly professional design language characterized by strong monochromatic elements and precise data visualization. The visual narrative is structured to convey scientific rigor, trust, and confidence in environmental commitments through minimalist presentation.
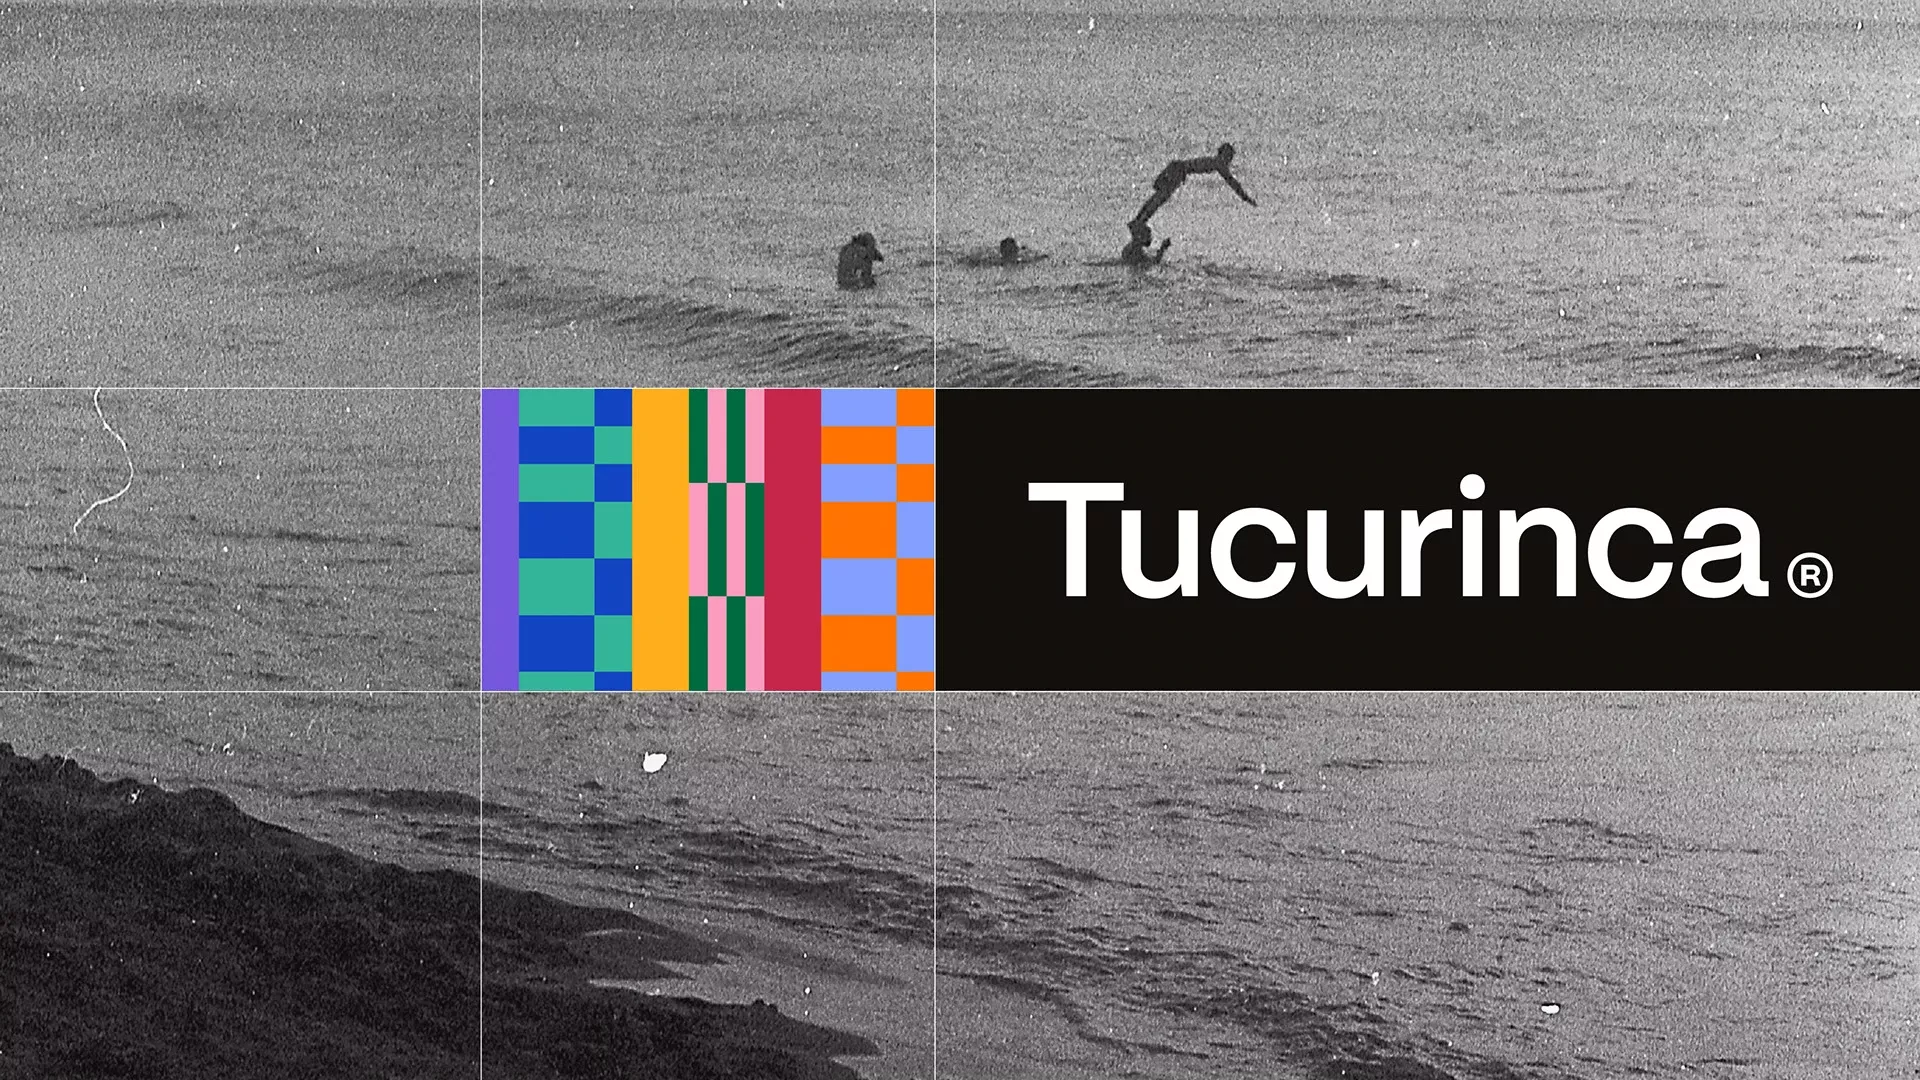
This image features a stark contrast between a monochromatic, textured natural landscape and vibrant, modern graphic elements. The composition juxtaposes organic scenery with structured data visualization through a colorful bar chart overlaid on the scene, creating a sense of scientific discovery or brand identity.
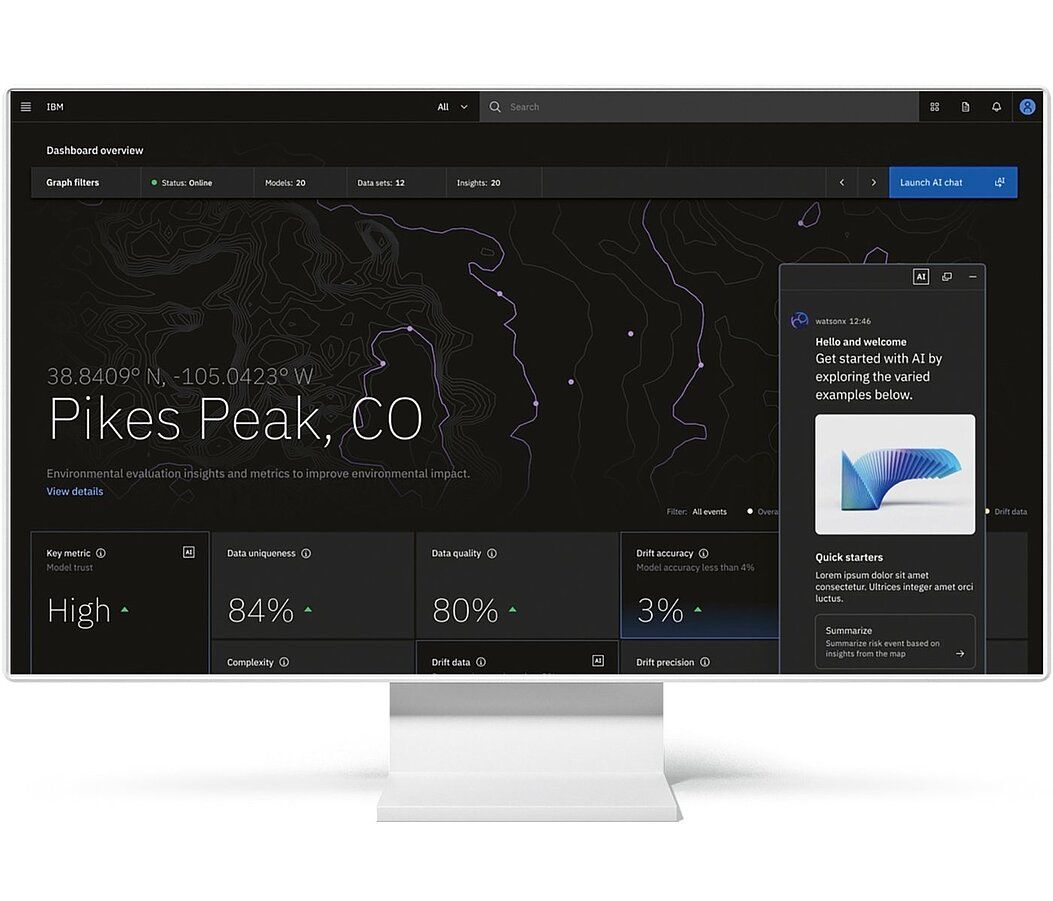
This dashboard features a clean, dark-mode interface optimized for displaying complex geospatial and environmental metrics. The design utilizes clear hierarchy, combining a topographical map with distinct metric cards to provide immediate analytical insights into the selected location. The visual language is professional, sparse, and highly focused on data readability.
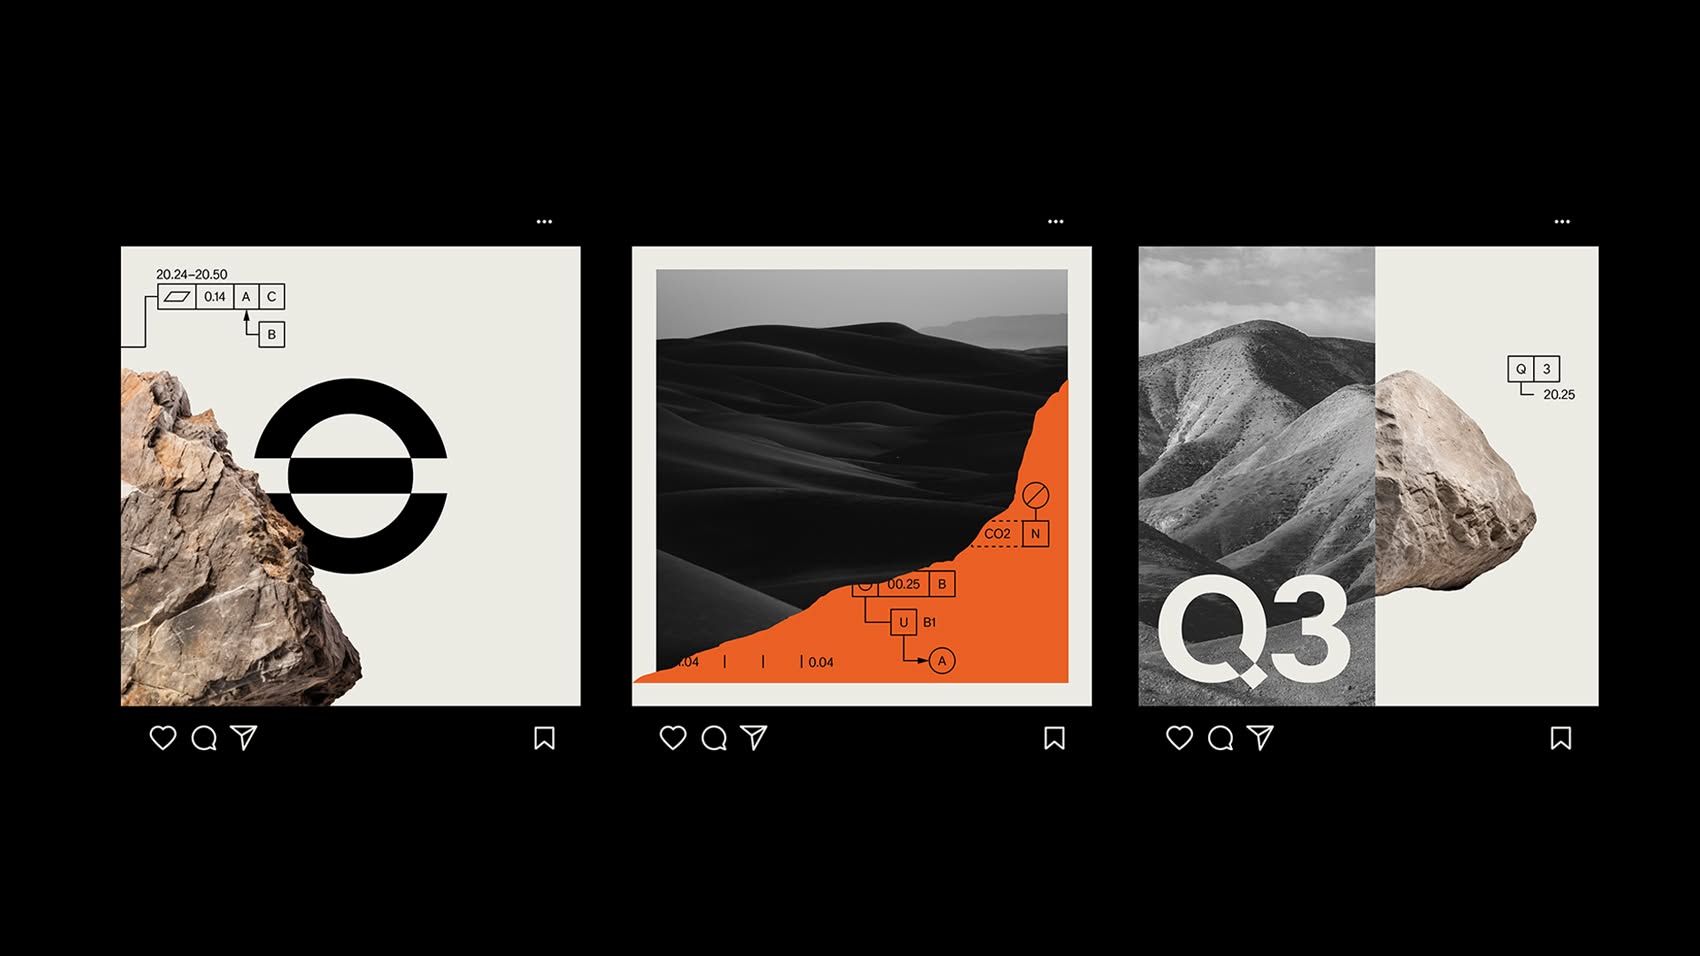
This visual presentation utilizes a stark, minimalist aesthetic characterized by high contrast and structured composition. The design effectively combines organic textures, such as rock formations, with precise geometric shapes and data visualizations to convey analytical information. The overall feel is professional, serious, and highly modern.
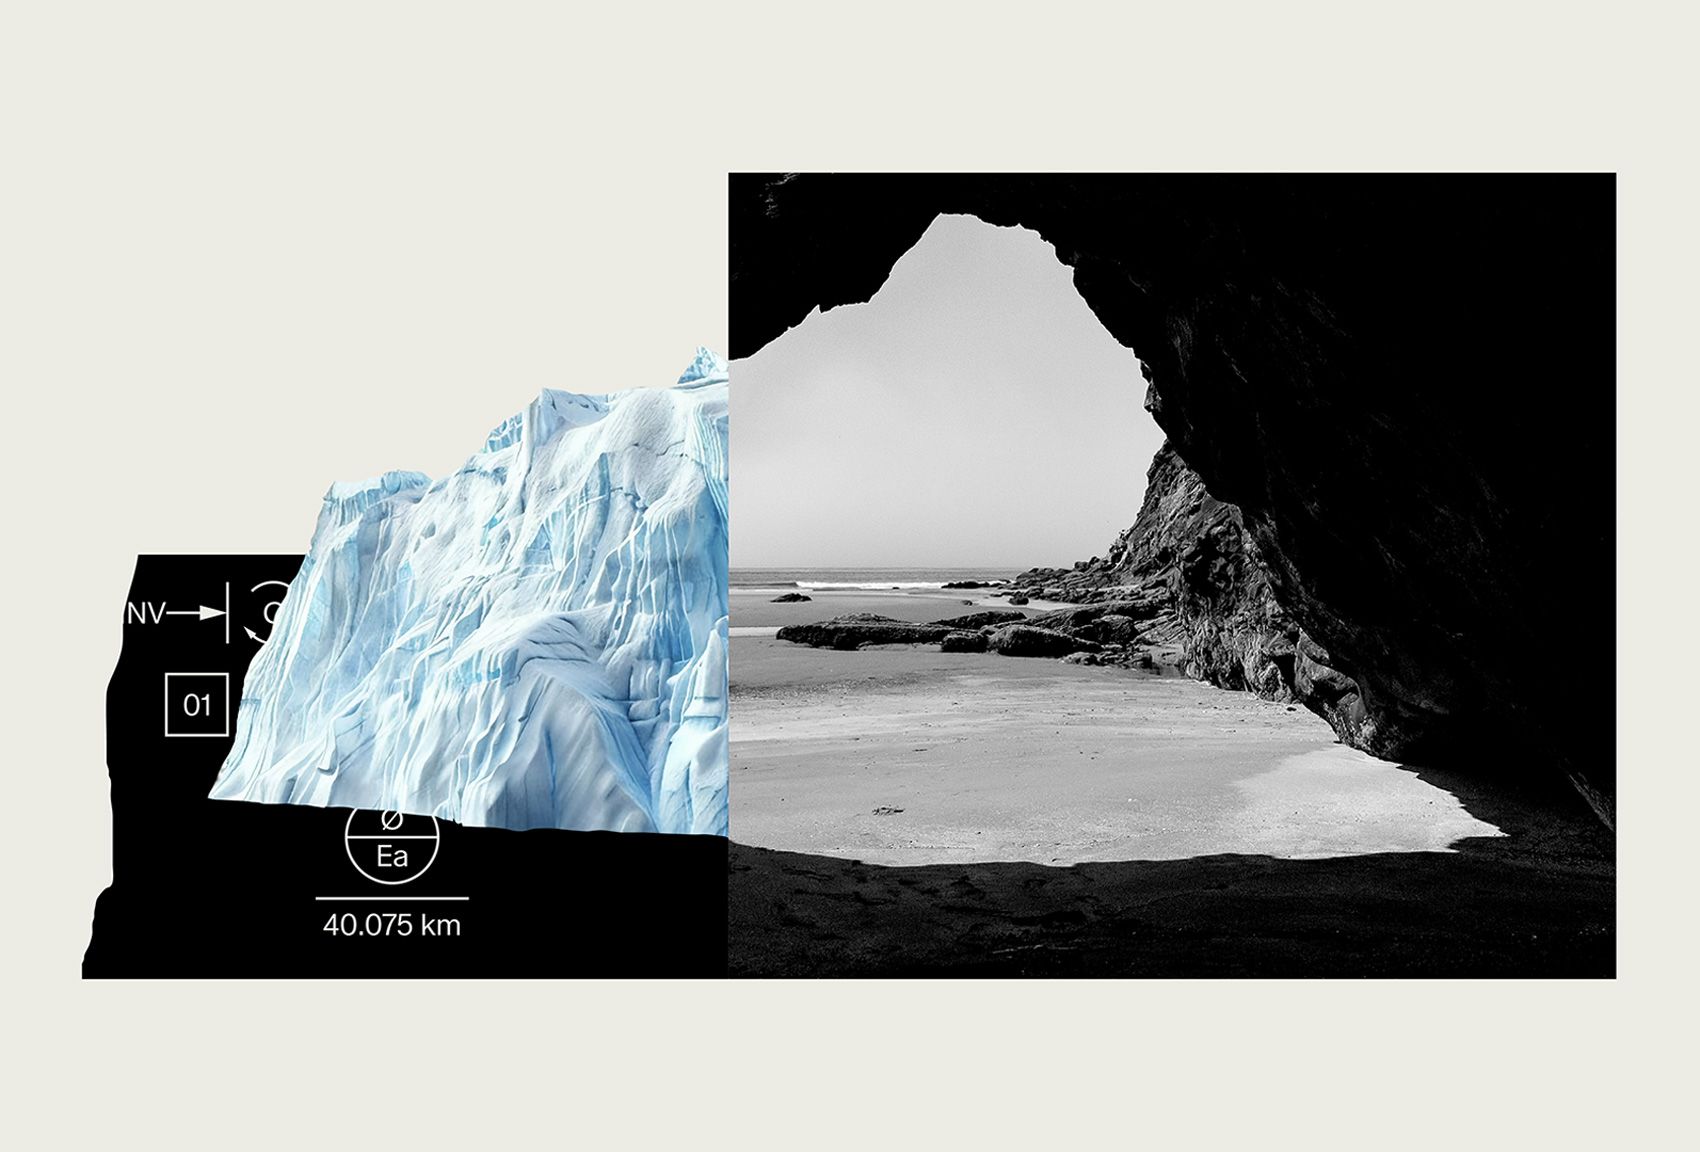
This design utilizes high contrast and juxtaposition to present geological imagery, pairing the fragile texture of glacial ice with the immense scale of dark rock and seascape. The visual language is stark and dramatic, employing negative space effectively to draw attention to both the icy detail and the rugged terrain. The overall feel is scientific, powerful, and deeply atmospheric.