digital analytics
4 designs
Showing 4 of 4 (4 total)
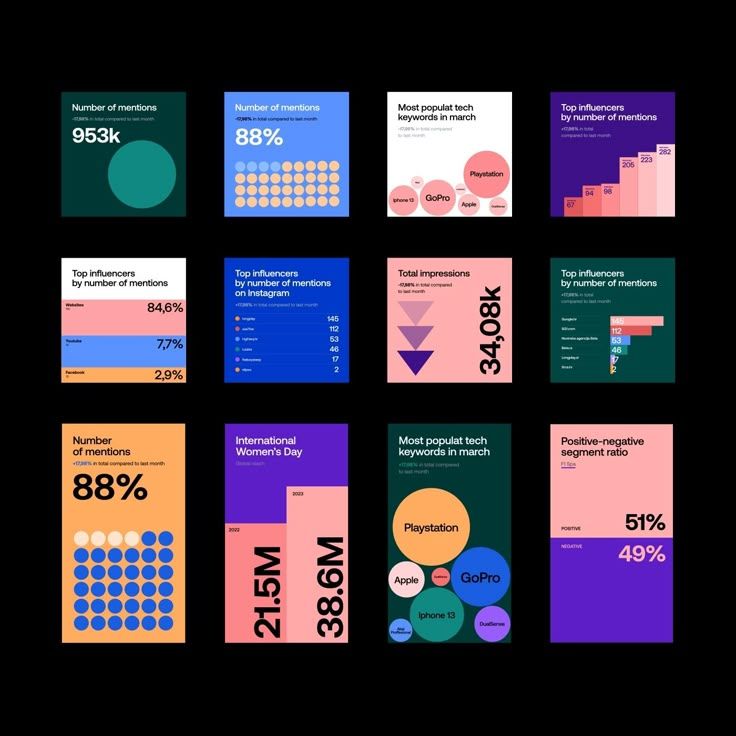
The image presents a grid of data visualizations, likely representing search engine or social media metrics, characterized by a clean, modern, and somewhat corporate aesthetic. It uses distinct color blocks and simple charts to convey quantitative information clearly.
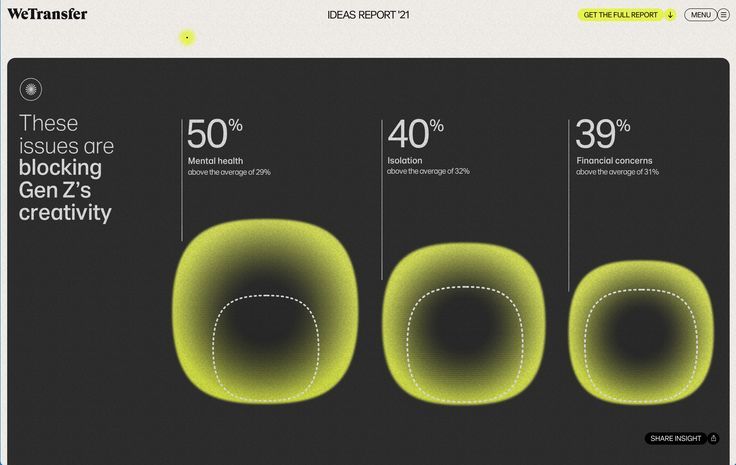
The design uses a dark, minimalist aesthetic with vibrant, glowing yellow/green elements to present data points. It employs a clear, segmented layout to highlight specific negative impacts on Gen Z creativity, creating a serious yet visually engaging analytical feel.
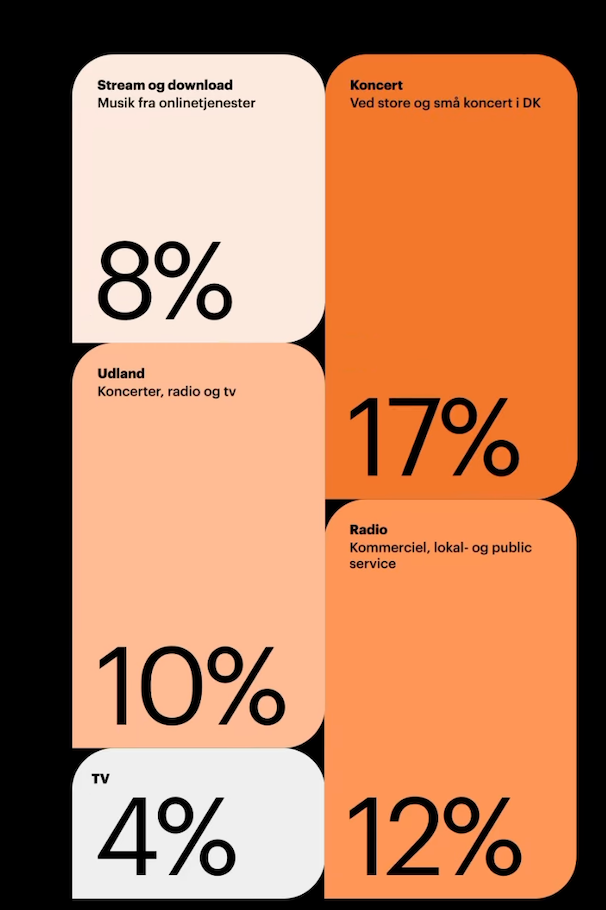
The image presents a clean, minimalist data visualization using large, rectangular cards with soft pastel backgrounds and bold, dark typography. The design emphasizes clear segmentation of data points through strong color blocking and ample negative space.
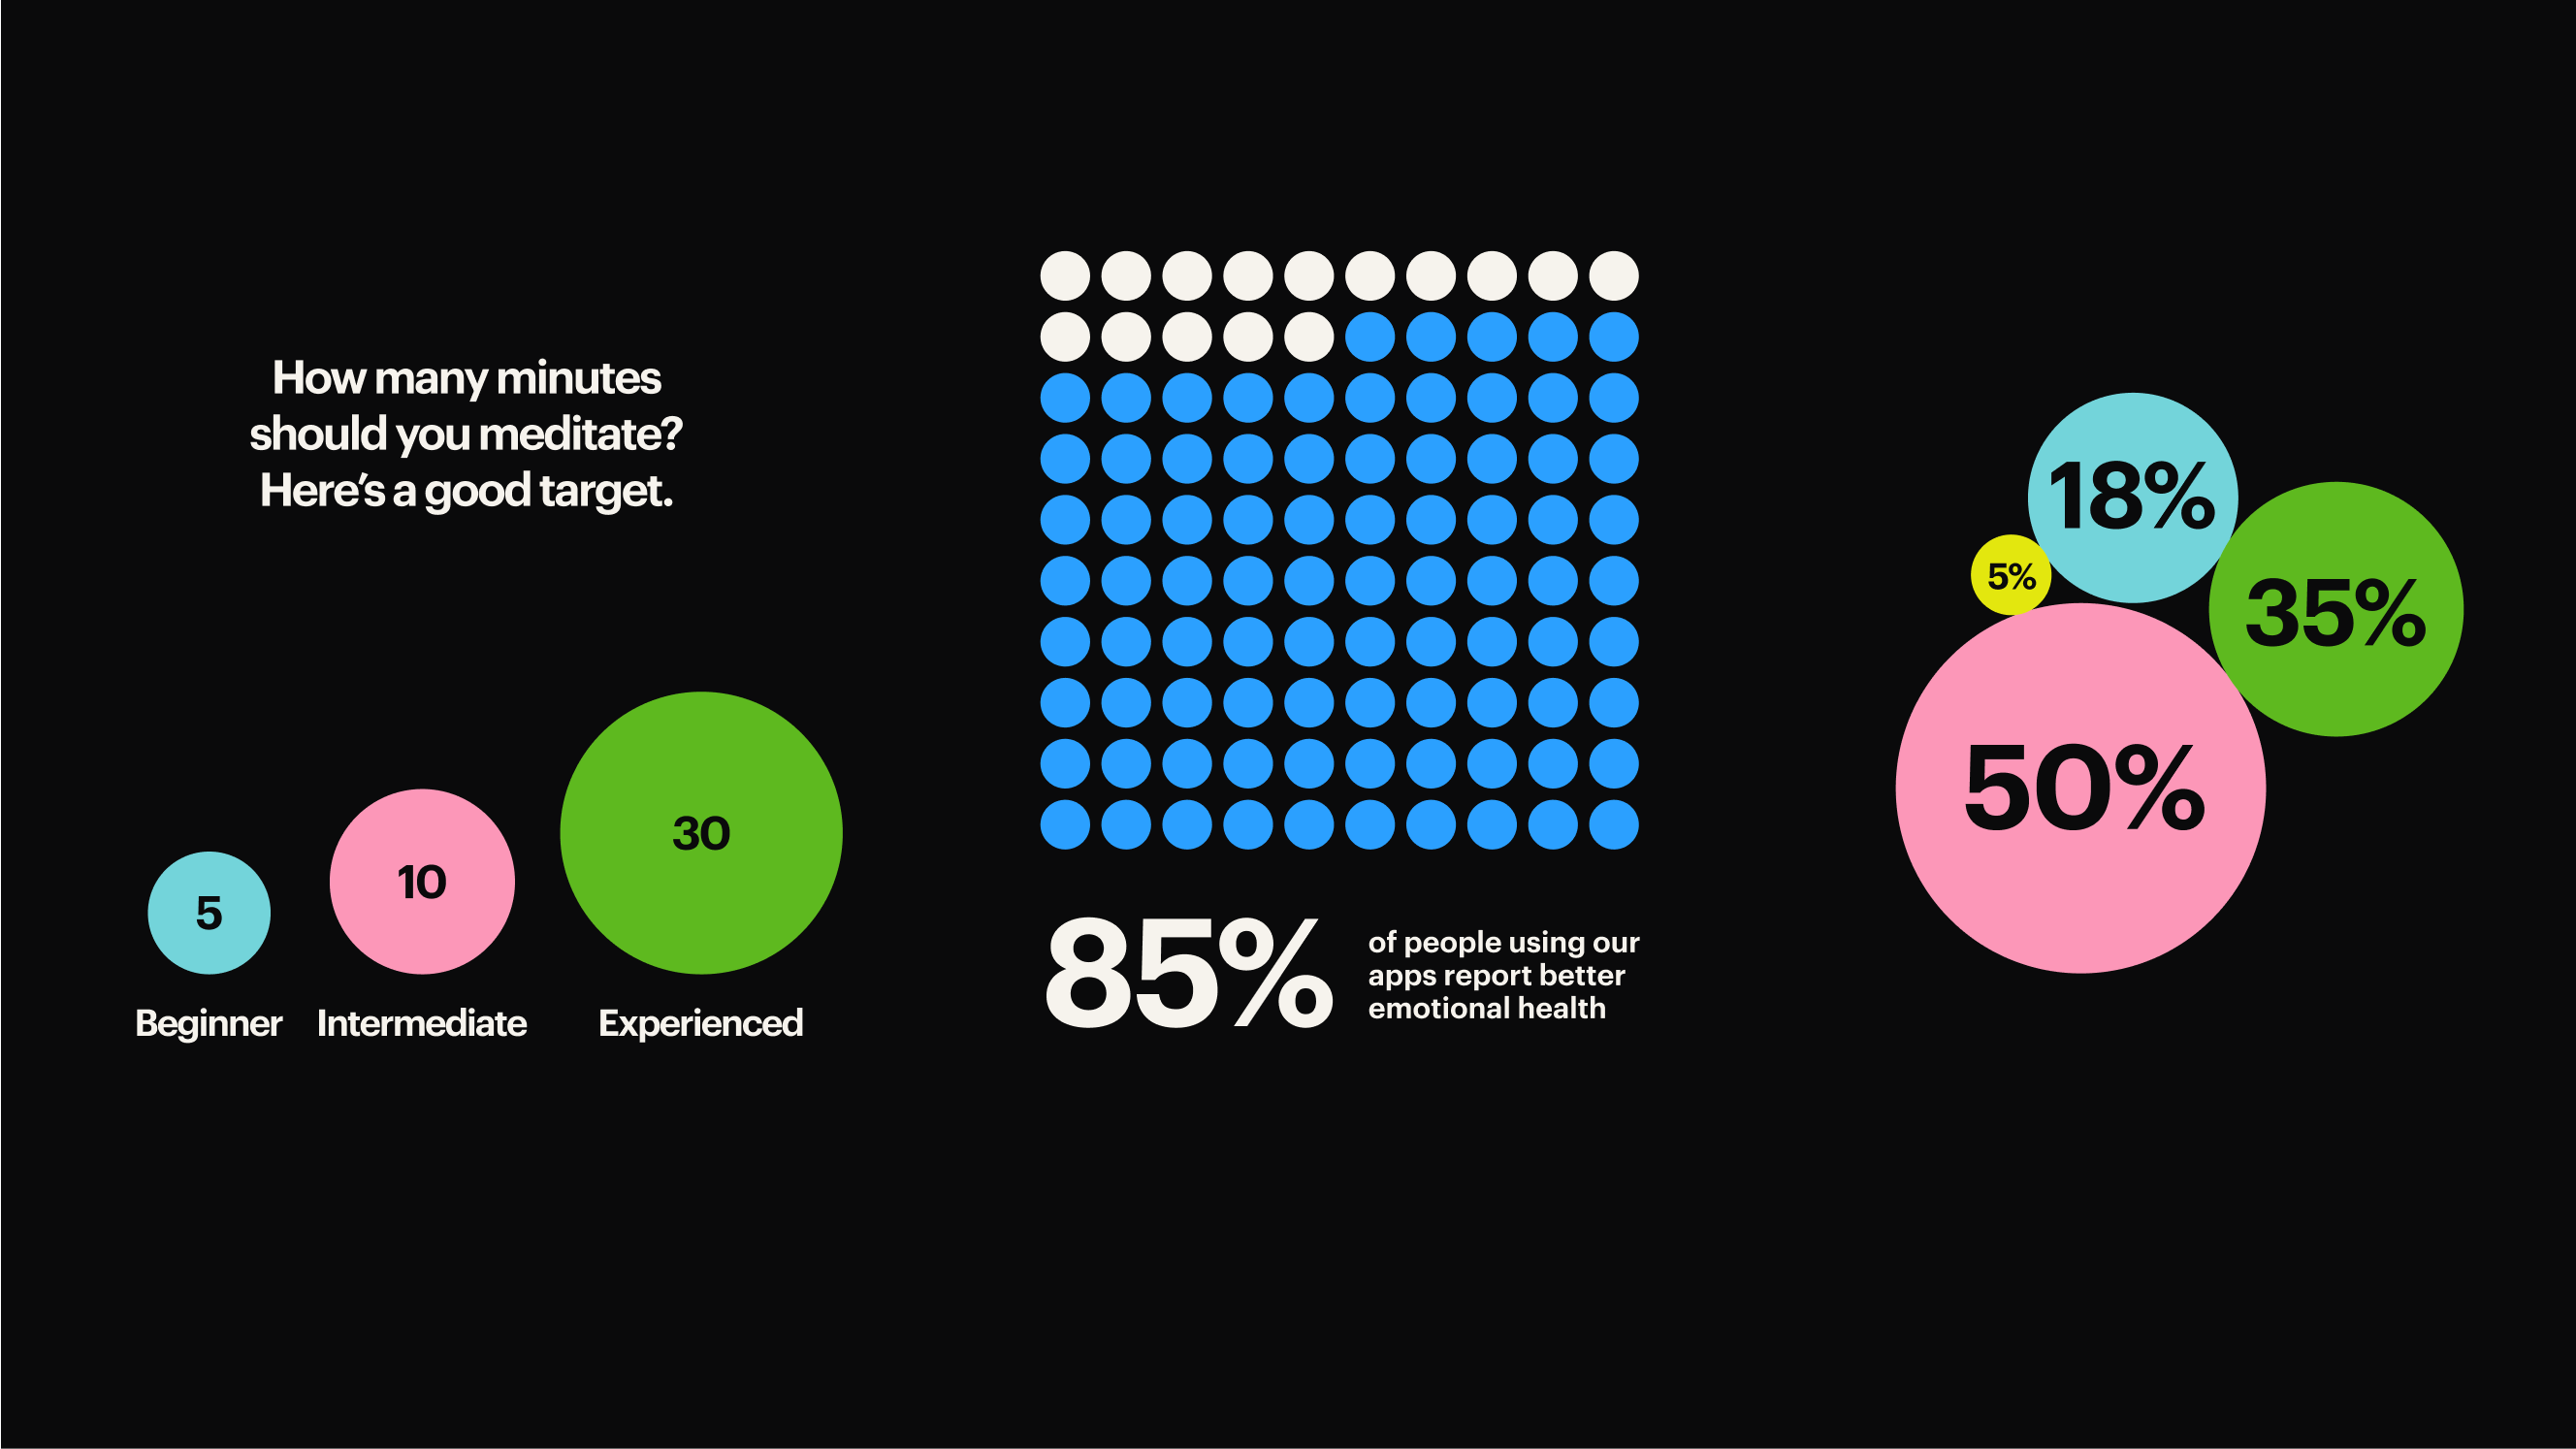
This is a clean, data-heavy infographic utilizing high contrast between dark and bright colors to present clear metrics. The design employs a combination of circular graphics, dot patterns, and segmented charts to effectively visualize quantitative data. The visual language is professional and focused entirely on statistical communication.