data science
101 designs
Showing 24 of 101 (101 total)
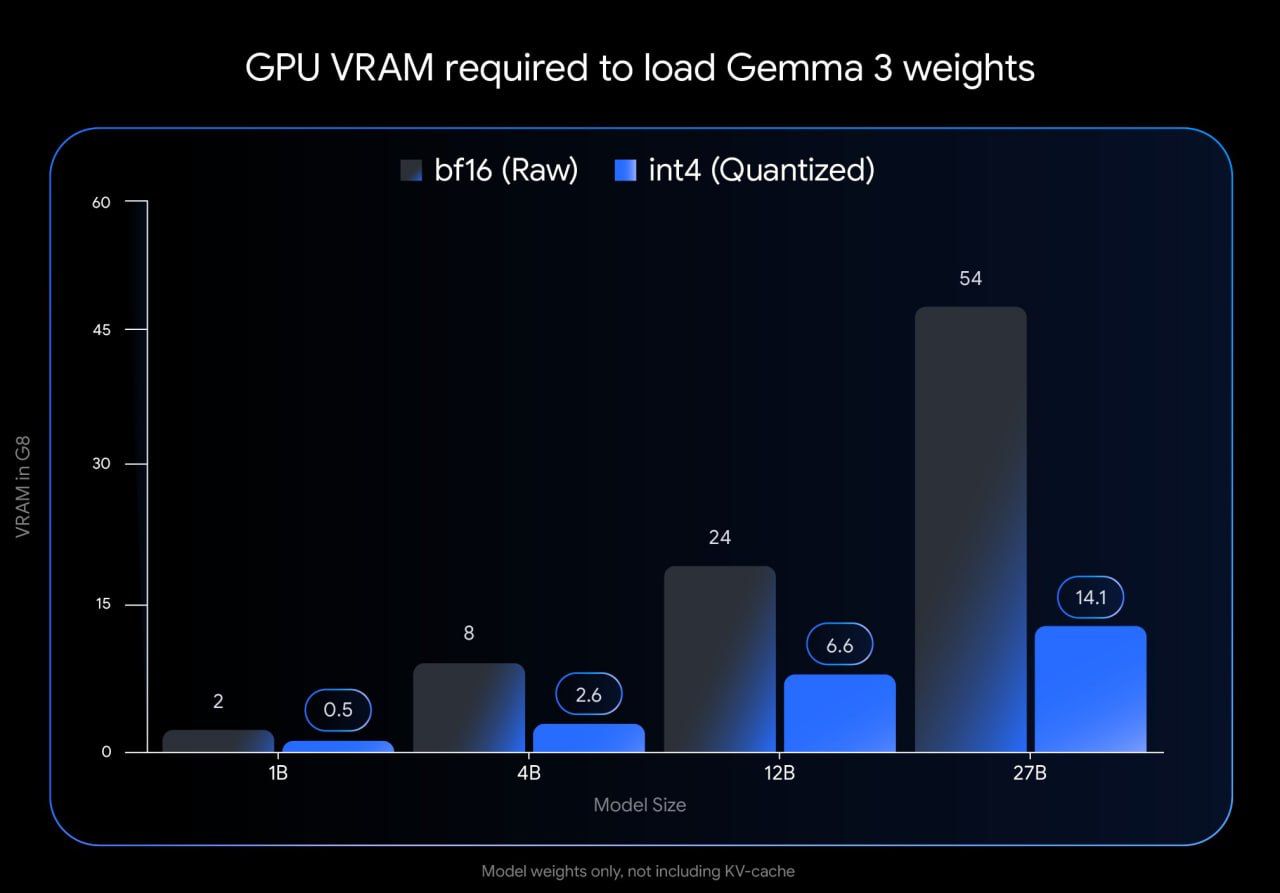
This is a data visualization presenting the required GPU VRAM for loading different sizes of Gemma 3 weights, comparing raw (bf16) and quantized (int4) versions. The design is functional and stark, focusing purely on comparative performance metrics.
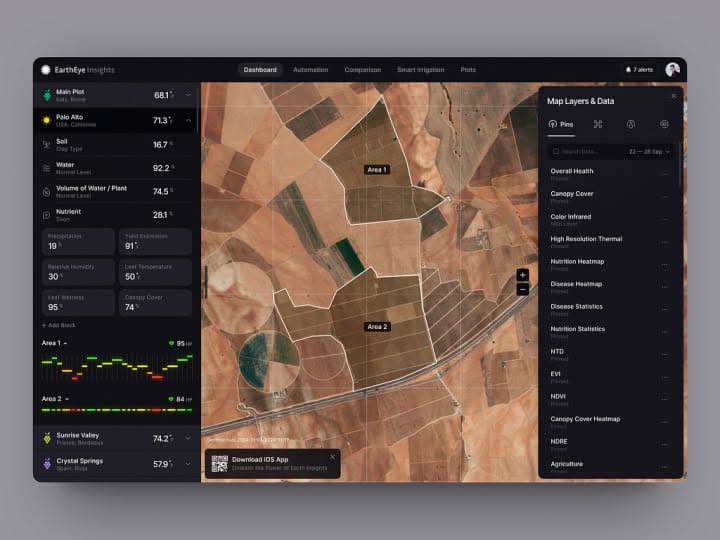
This dashboard features a professional, data-intensive design utilizing a dark theme to emphasize the geospatial imagery. The visual language is clean and functional, prioritizing clear data presentation over decorative elements to create an analytical and immersive user experience.
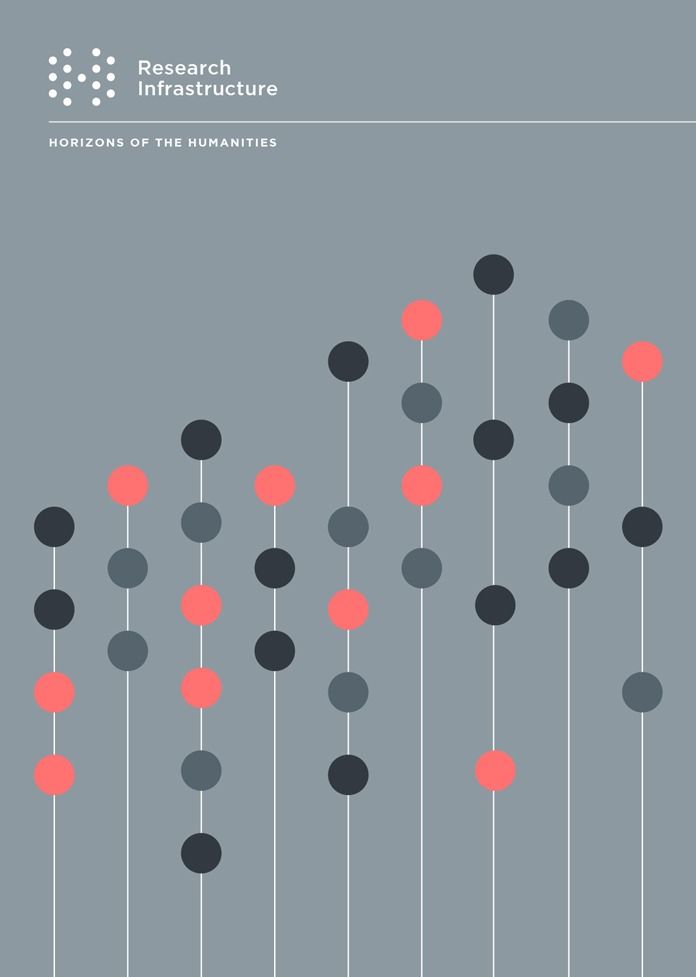
This design utilizes a clean, minimalist aesthetic to visualize abstract concepts, employing vertical lines and colored dots to represent data or progression. The visual language is highly structured and precise, conveying a sense of academic rigor and organized research.
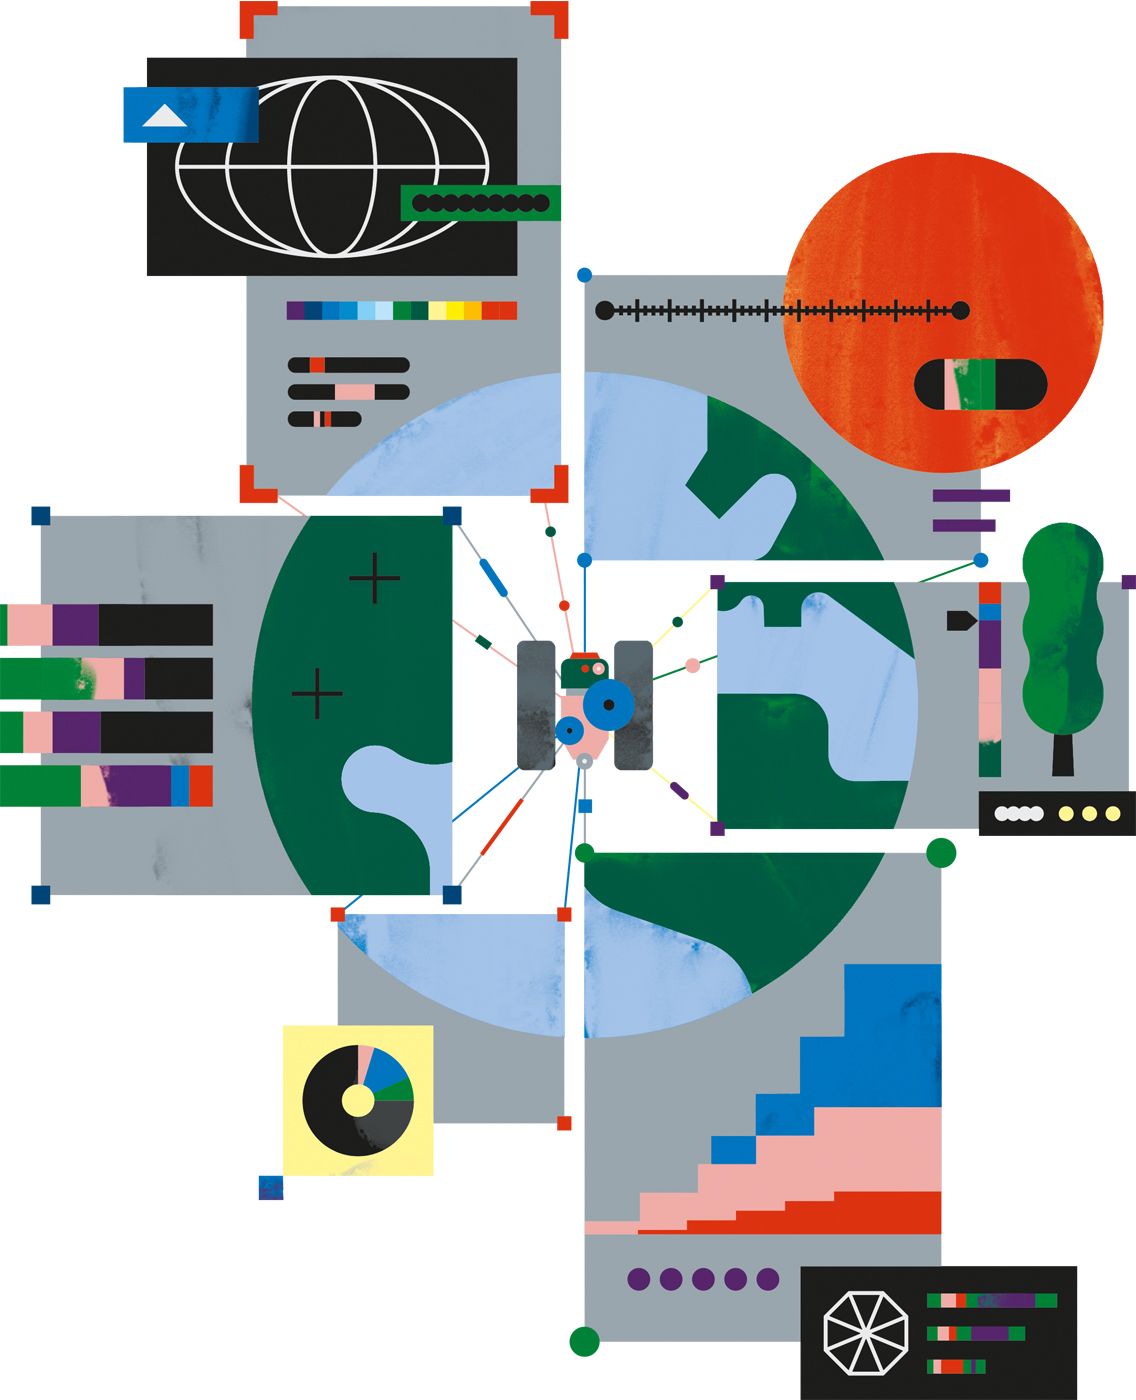
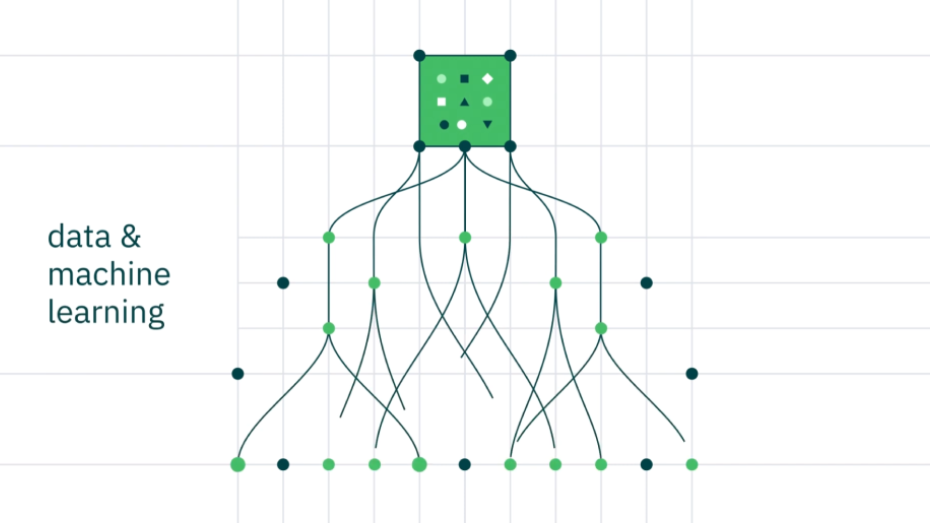
This is a complex, modular data visualization characterized by clean geometric shapes and interconnected lines. The visual language emphasizes structure, connectivity, and the mapping of abstract information into a coherent diagrammatic system. The overall feel is highly technical and analytical.

This design uses an abstract, fluid line graphic to symbolize complex data networks and connectivity. The visual language is clean and modern, employing soft gradients and interconnected nodes to convey themes of innovation and problem-solving. The composition is balanced, pairing clear textual information with dynamic visual metaphors.
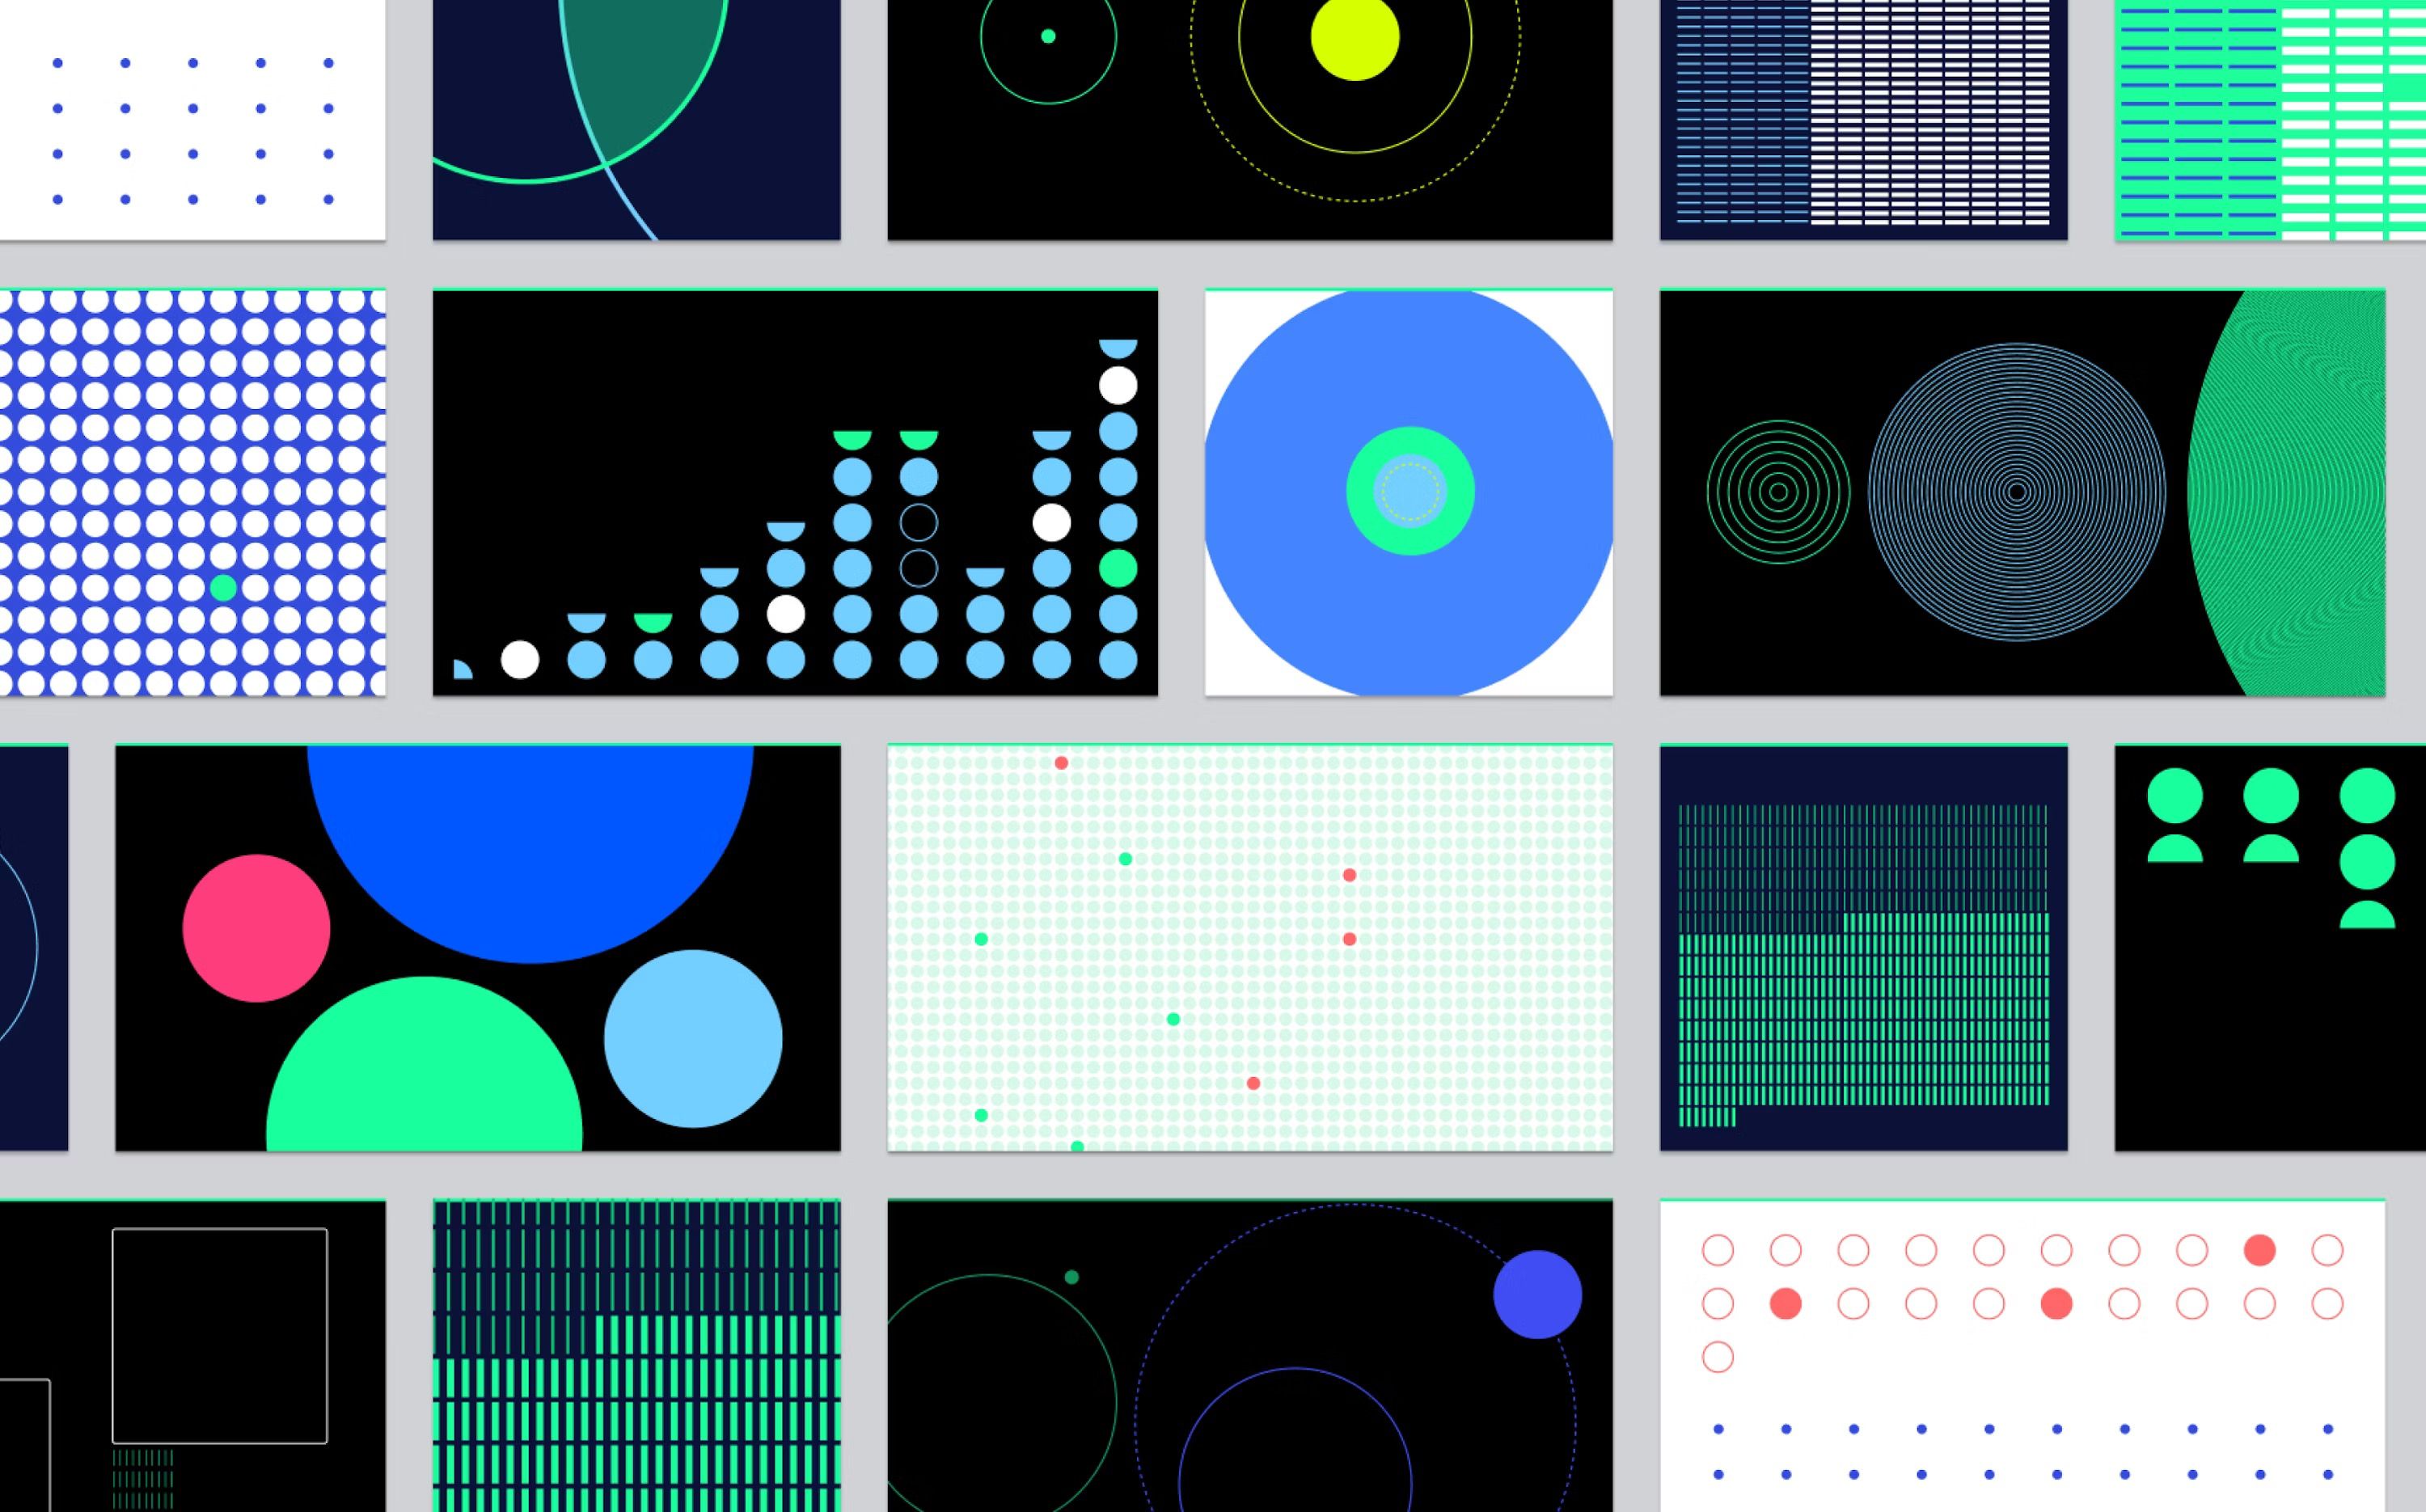
This image presents a modular grid of abstract data visualizations characterized by geometric shapes, dotted patterns, and bar graphs set against a dark background. The visual language is clean, modern, and highly focused on conveying information through color contrast and spatial arrangement. The overall feel is analytical and futuristic, suggesting complex data processing.
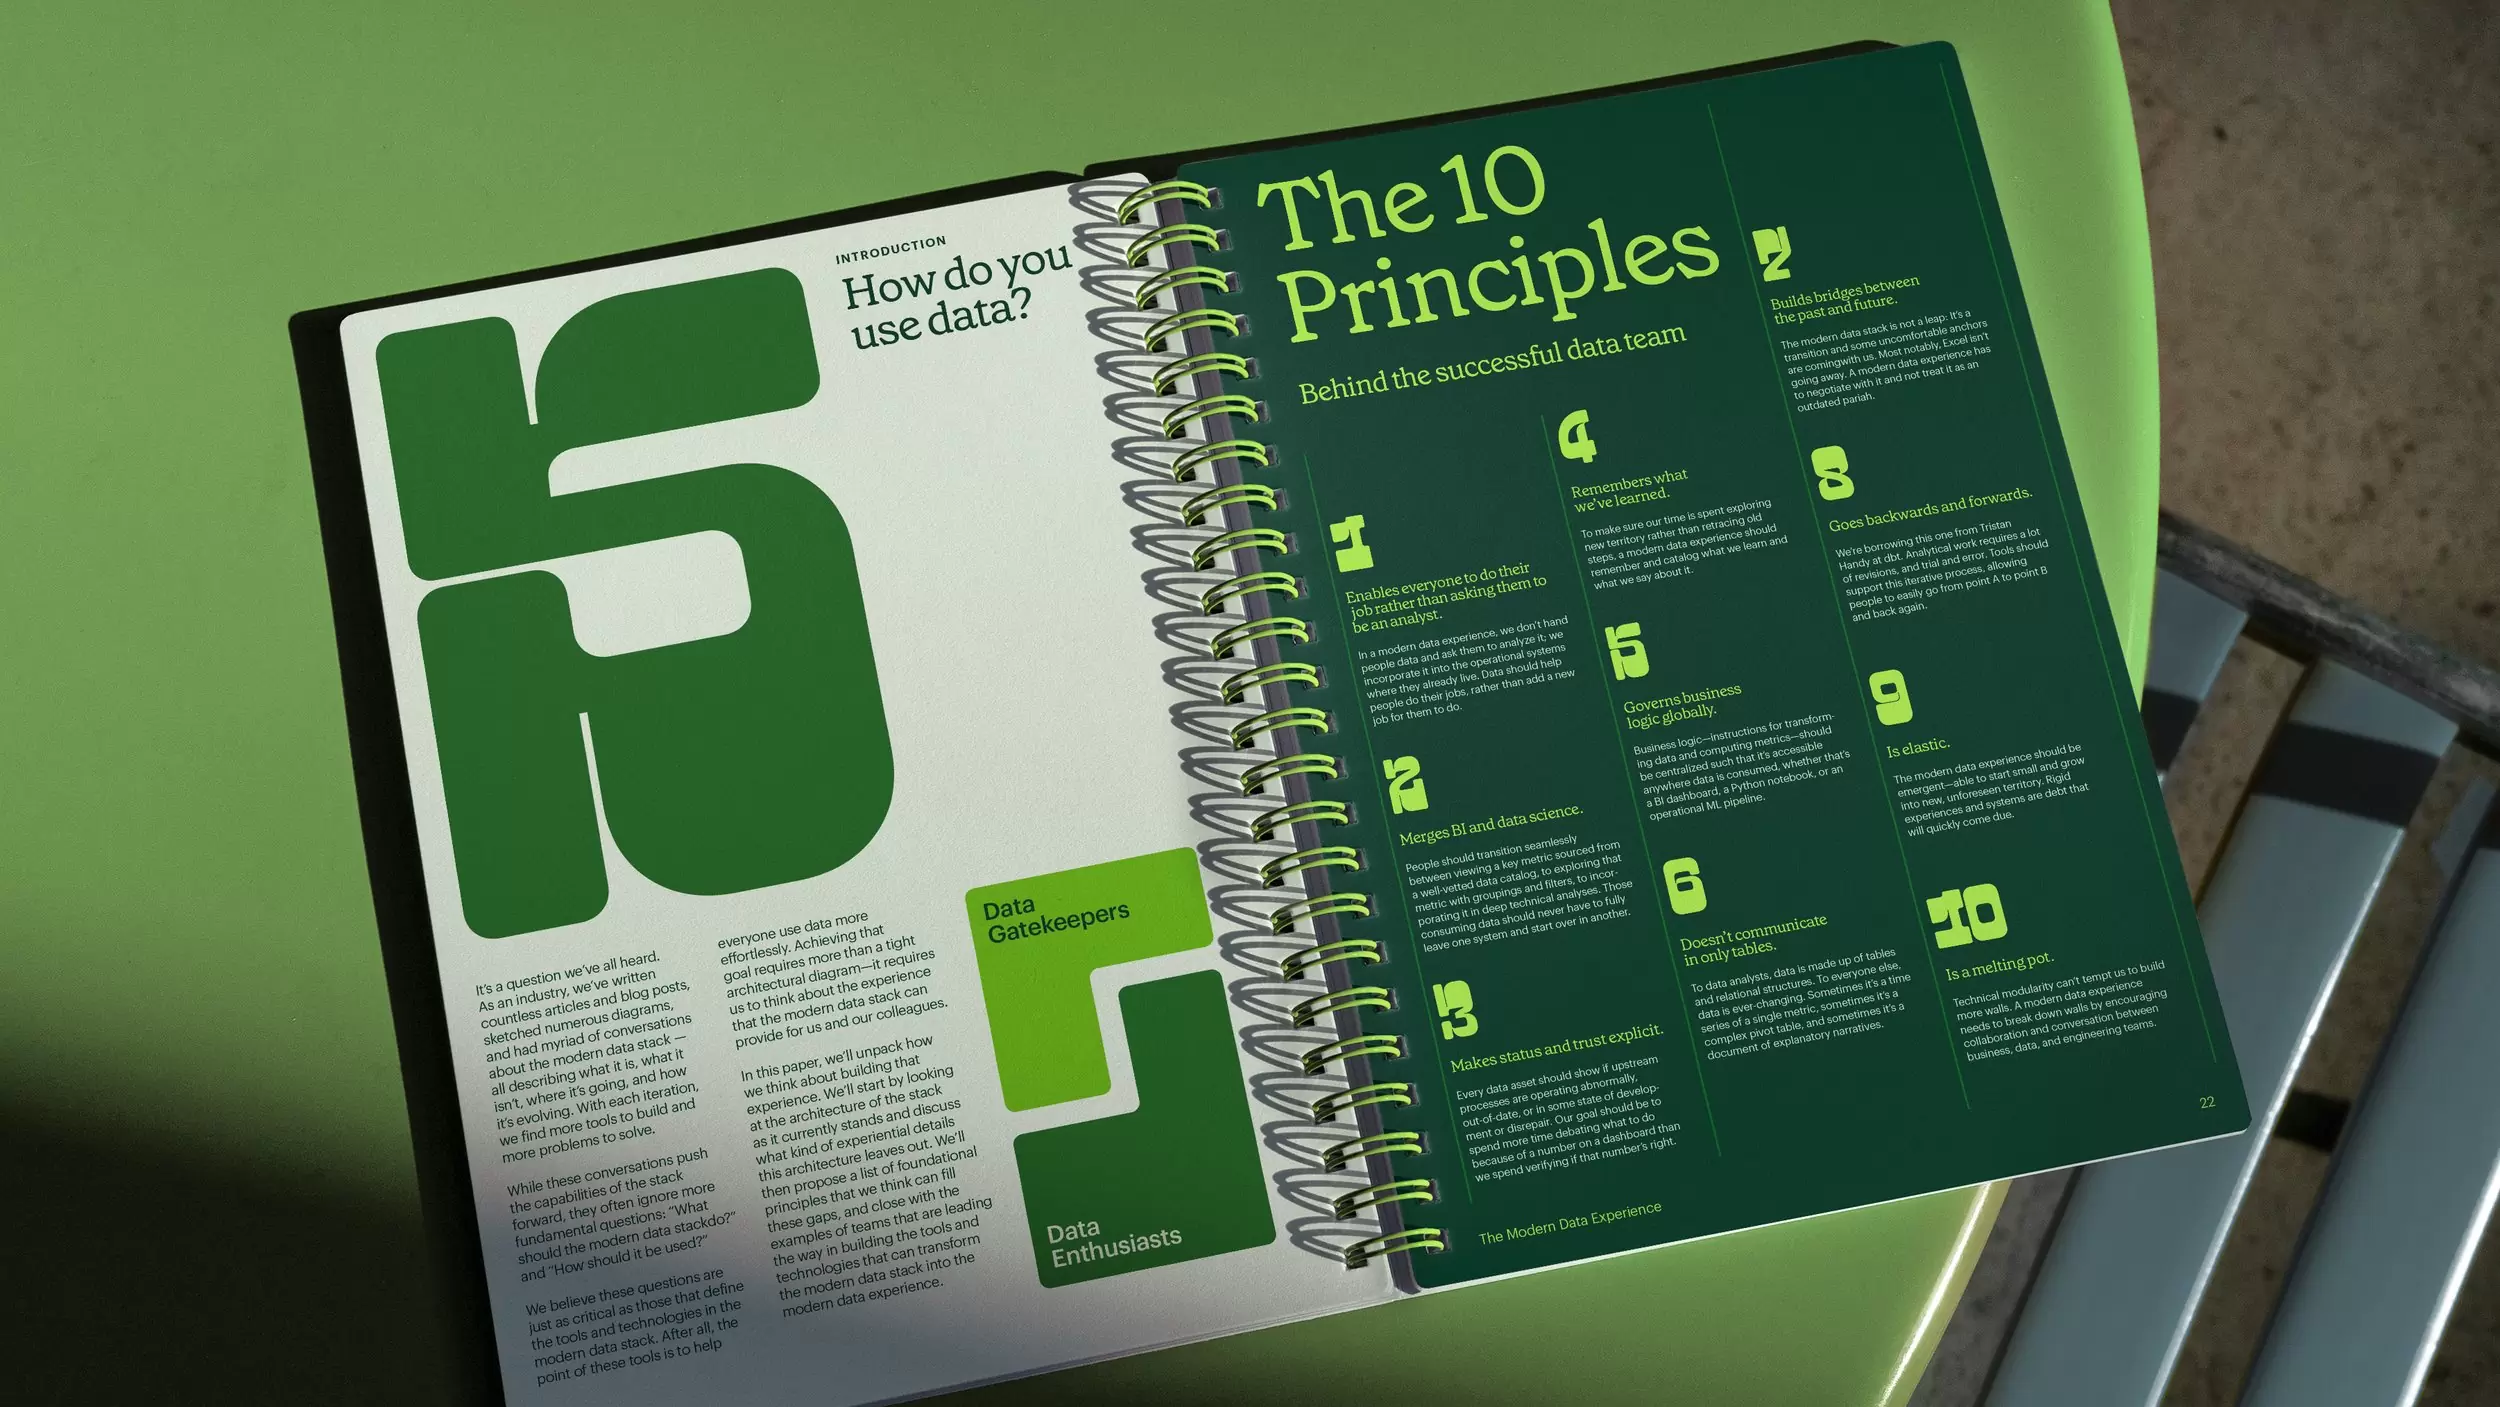
This design employs a clean, structured layout typical of instructional guides, utilizing a strong monochromatic palette of deep greens and white to convey professionalism. The visual language is highly organized, relying on clear typography and numbering to establish a strong hierarchy for complex information.
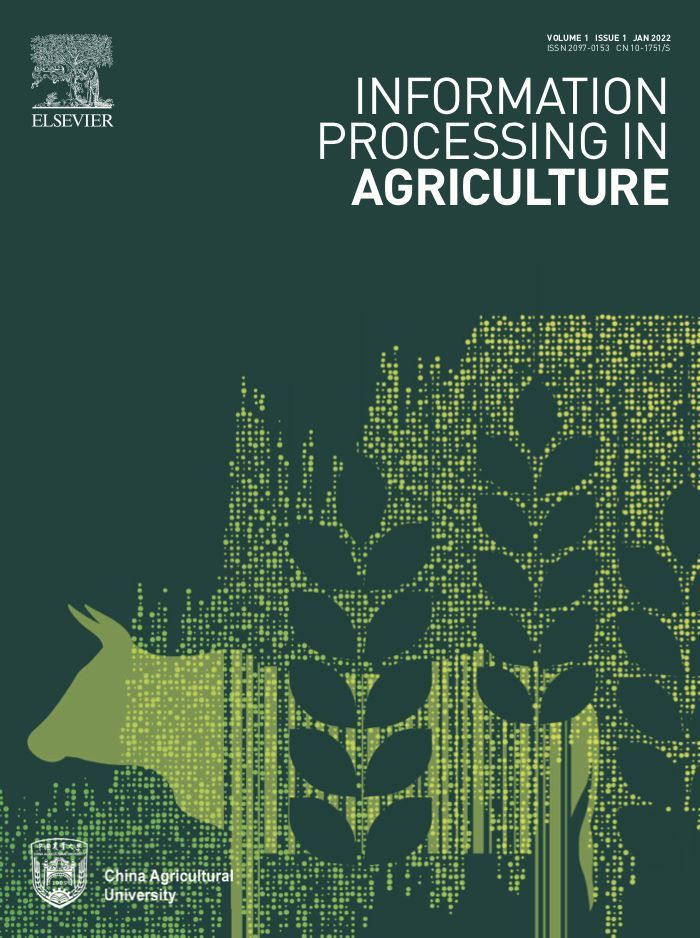
This cover blends organic natural imagery, such as livestock and foliage, with digital data visualization elements to represent the intersection of agriculture and information technology. The design uses a dark, moody palette punctuated by glowing chartreuse accents to create a modern and academic feel.
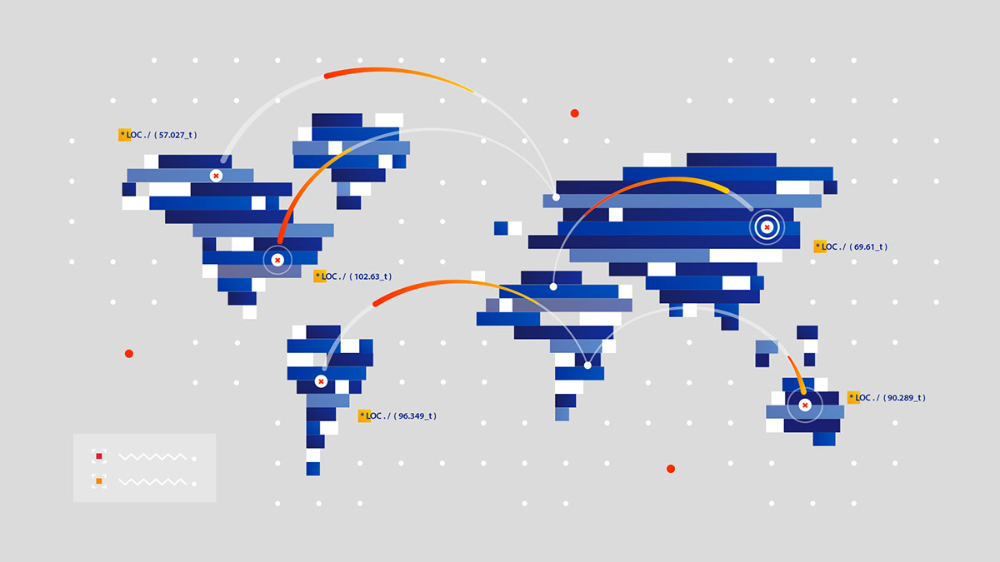
This is a clean, minimalist data visualization using an abstract world map to represent network connections and geographical data. The design effectively uses color contrast and line work to illustrate relationships between various nodes across the map.
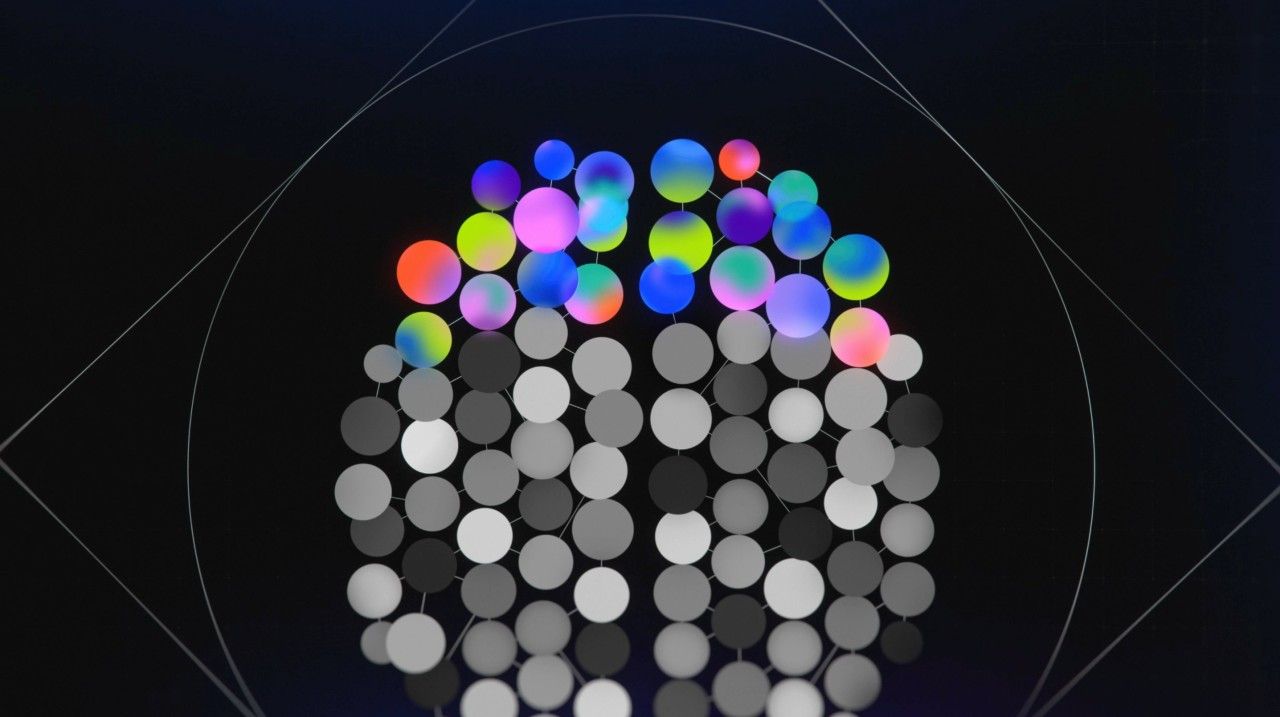
This image presents an abstract, high-tech visualization resembling a neural network or data cluster, utilizing vibrant, glowing spheres against a deep black background. The design effectively conveys complexity and interconnectedness through the arrangement of colored points, suggesting themes of science, technology, or cognitive mapping.
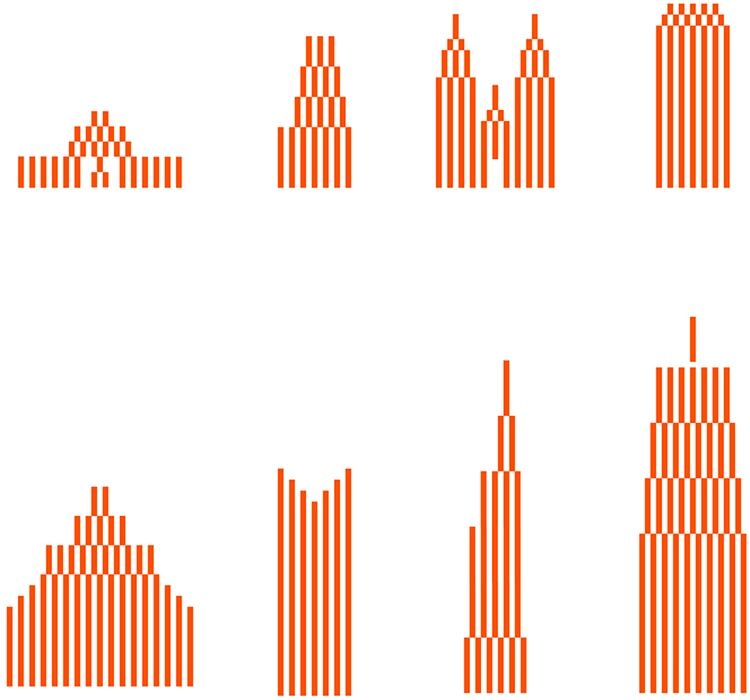
This image presents a series of minimalist vertical bar charts, utilizing a monochromatic palette to visualize data distribution or growth patterns. The design emphasizes structure and quantitative representation through the consistent use of orange lines against a stark white background.

This design uses a stark, high-contrast layout combining bold typography with complex data visualization elements. The visual language relies heavily on a grid structure and vibrant, blended color gradients to suggest mapping or network data. The overall feel is modern, technical, and investigative.
This is a clean, schematic diagram illustrating a concept like a neural network or data structure, using organic lines to represent connections. The design effectively conveys complexity and interconnectedness through a minimalist and structured visual language.
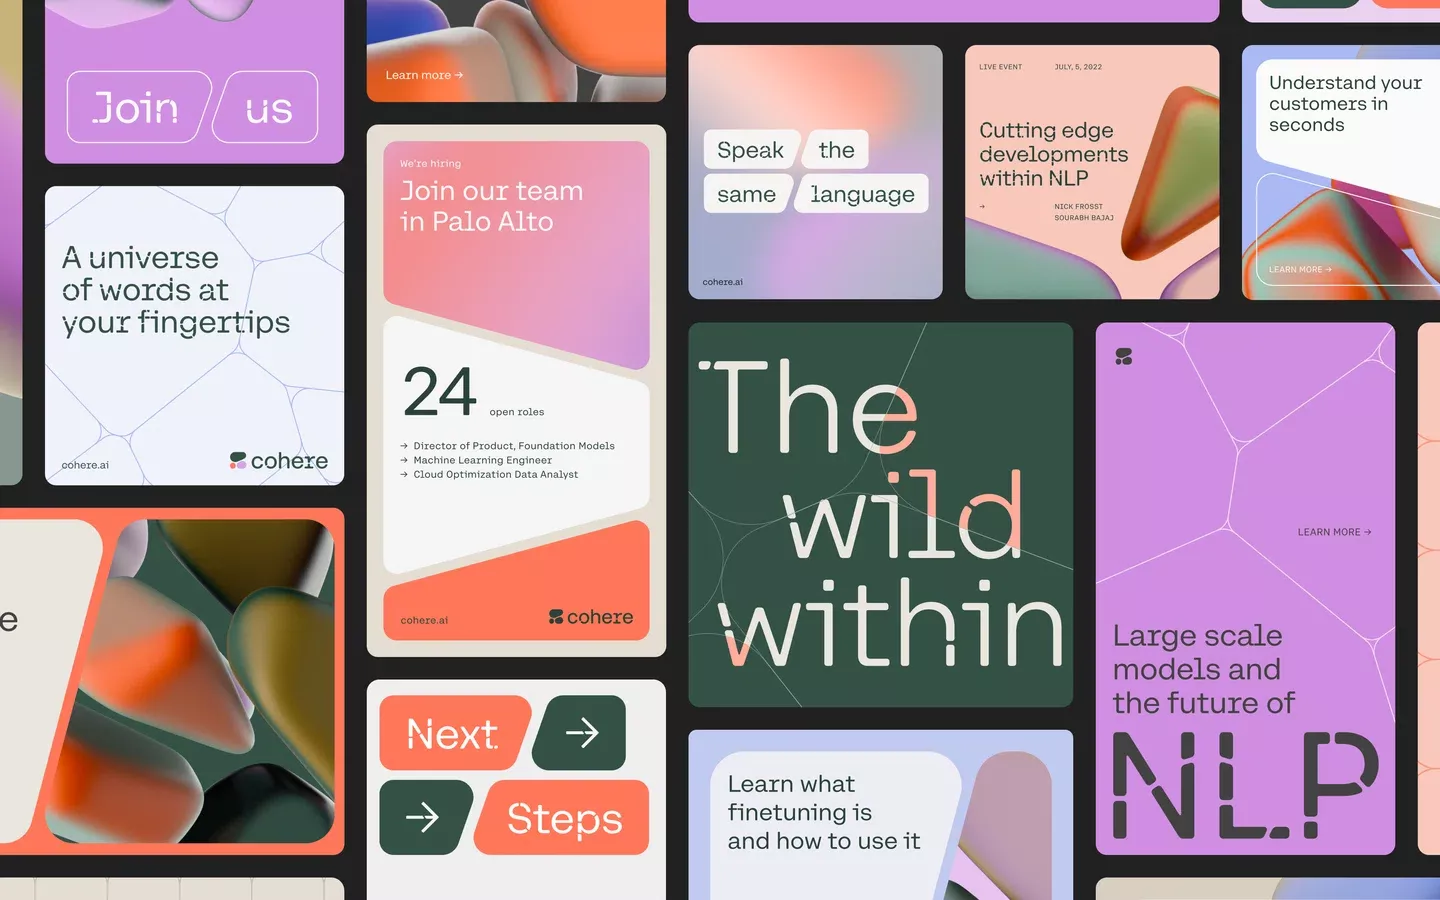
This design utilizes a clean, modular grid structure combined with soft gradients and rounded shapes to create a modern and inviting interface. The visual language is professional yet approachable, effectively communicating complex technical concepts through vibrant yet muted color combinations.
This design utilizes a strong split composition, contrasting clean white typography with a vibrant vertical block of magenta stripes against a dark background. The visual language is modern and energetic, effectively using color blocking to draw attention to the implied subject matter.
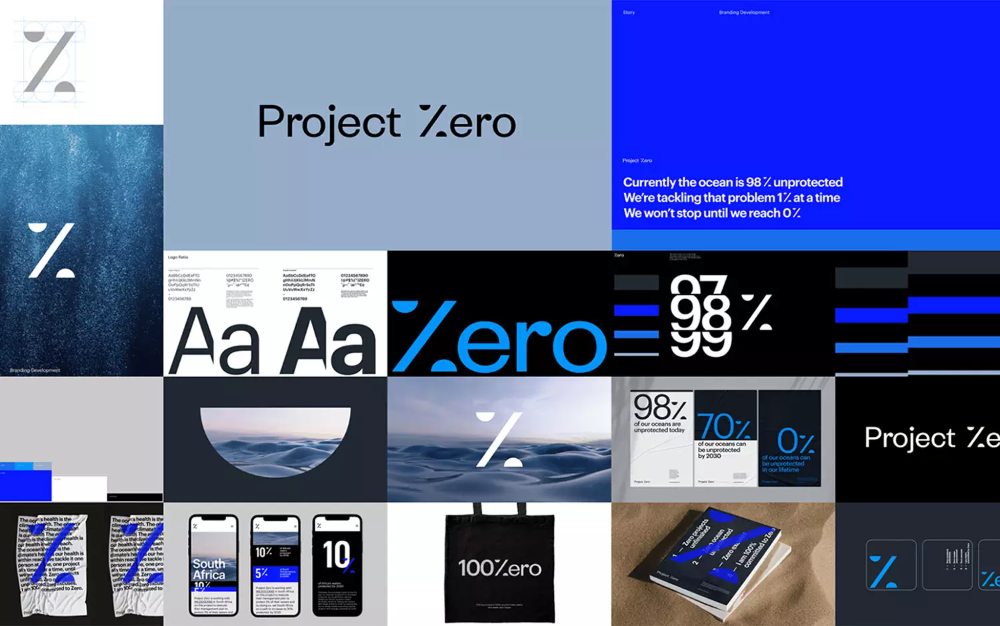
The design utilizes a stark, minimalist aesthetic dominated by shades of blue and black, employing large typography and geometric shapes to convey a sense of technical precision and focus. The visual language is clean, modern, and heavily reliant on percentage-based data visualization.
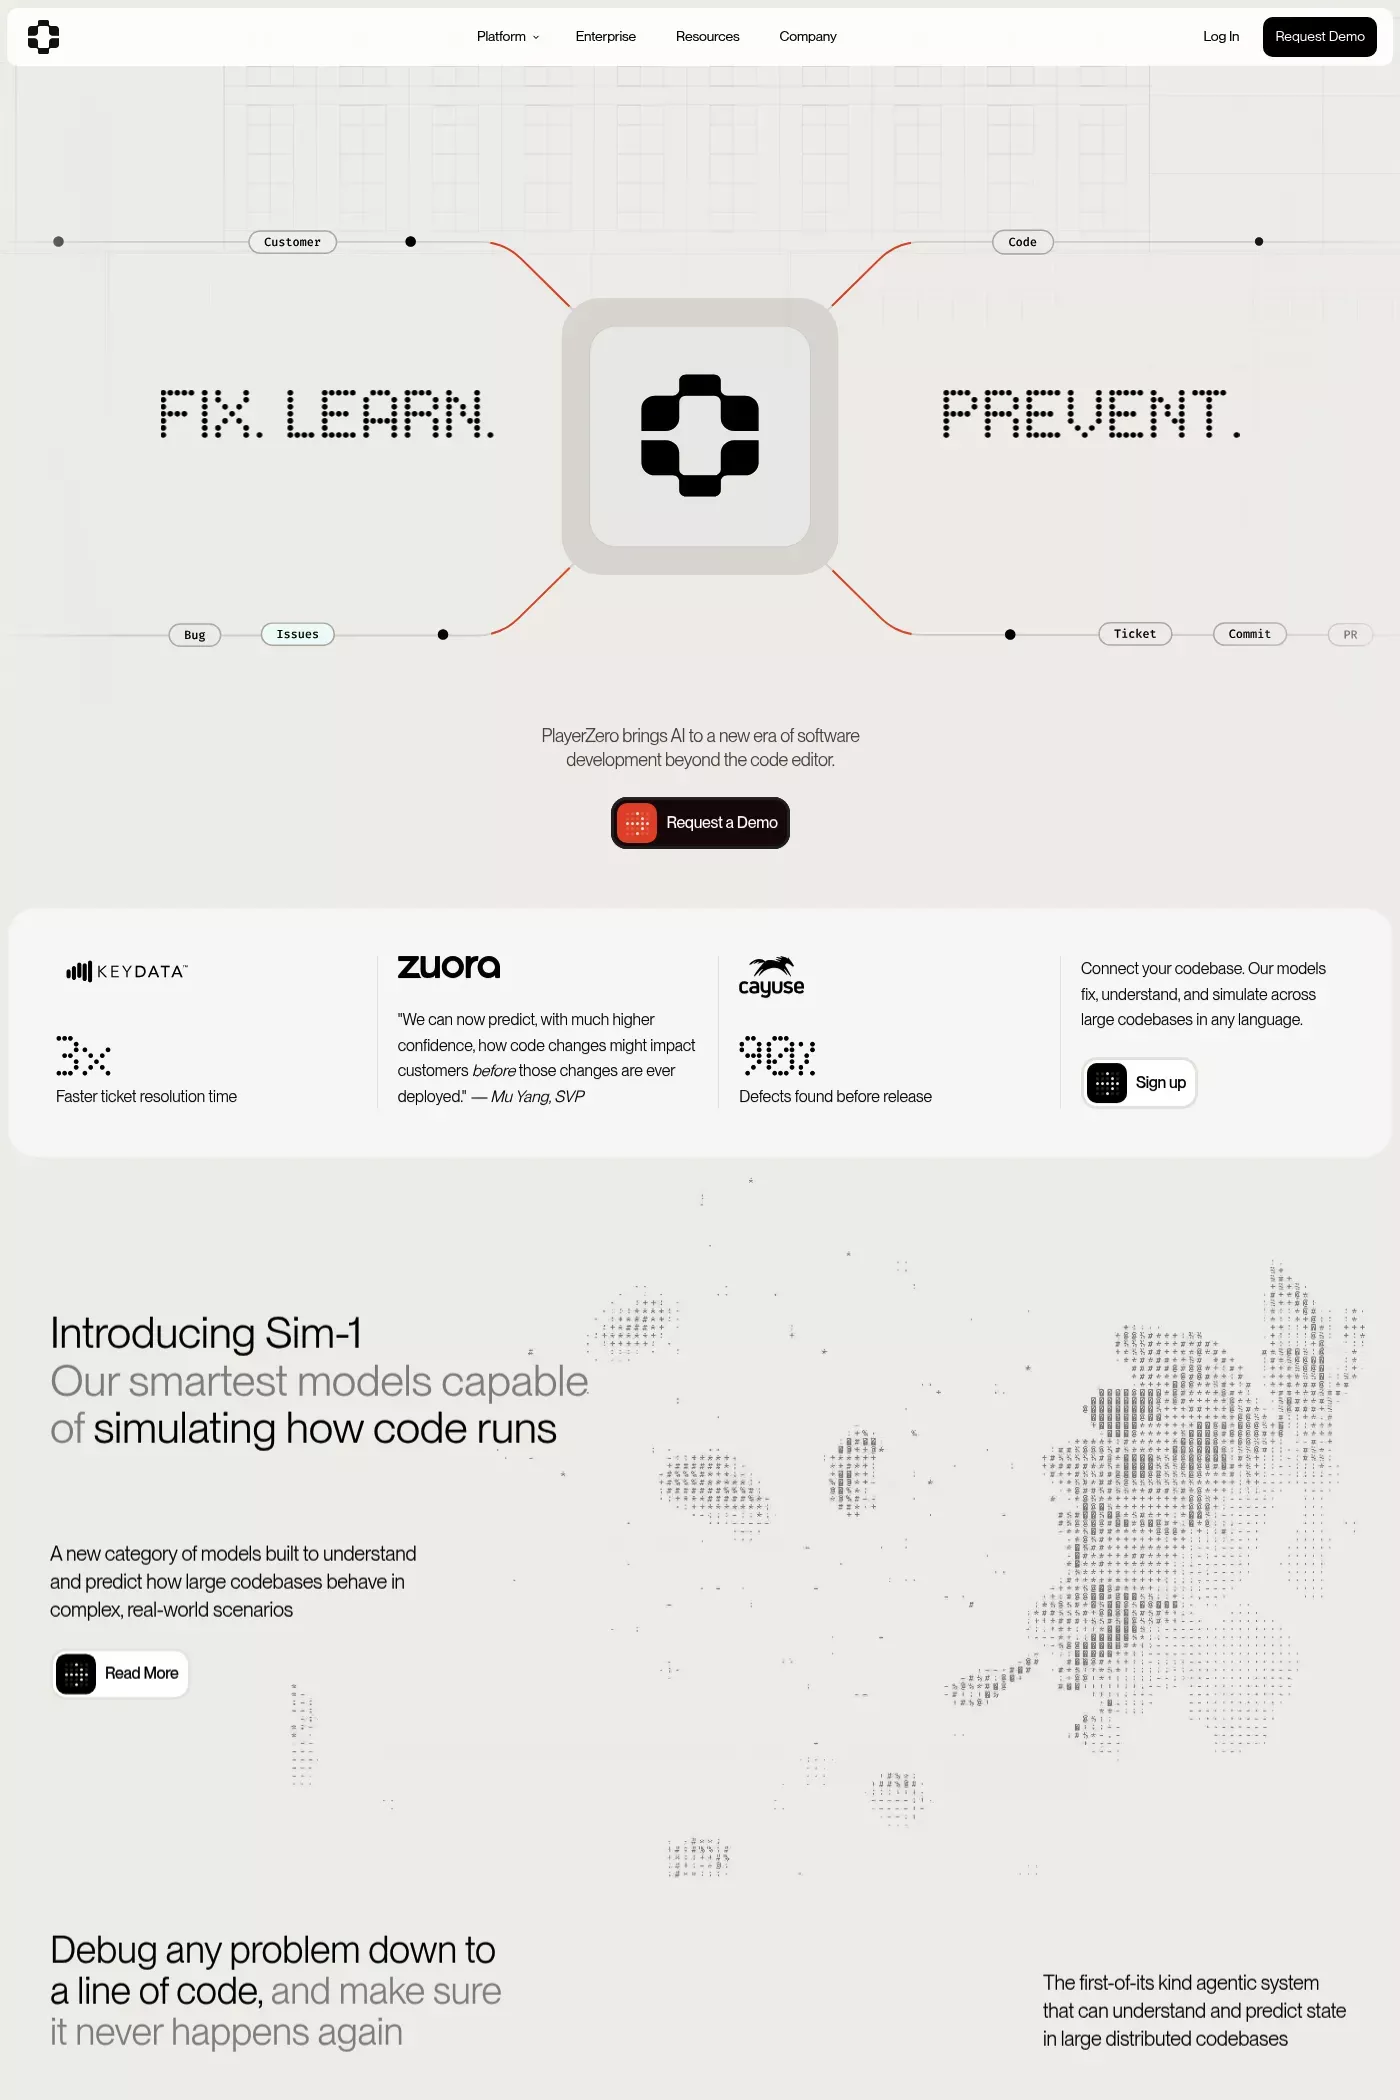
The design is clean, modern, and professional, utilizing ample white space to create a spacious and sophisticated feel. It employs a minimalist aesthetic with subtle use of color accents against a light gray background, suggesting competence and advanced technology.
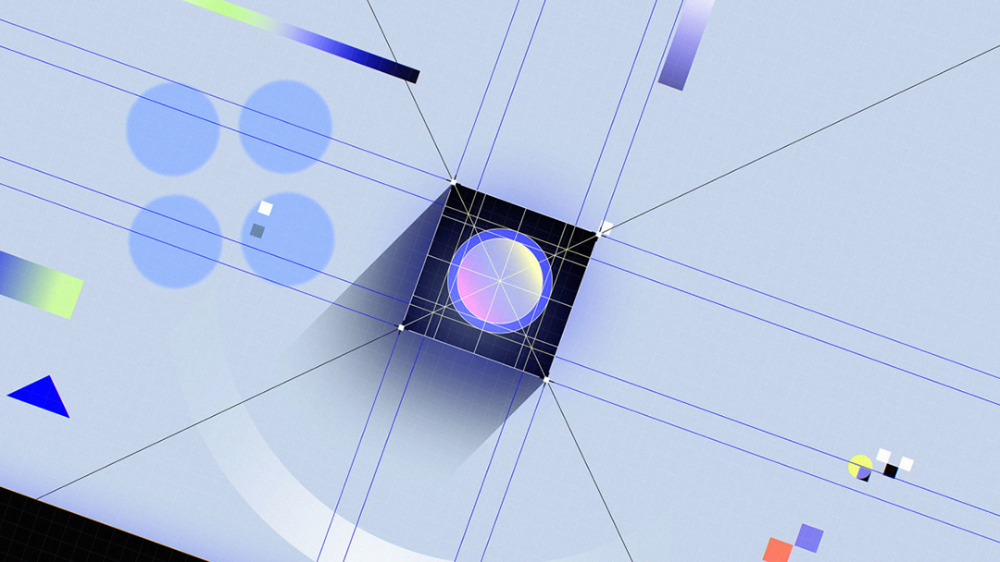
The image presents an abstract, technical visualization characterized by geometric lines, overlapping circles, and a central focal point suggesting data or spatial mapping. The visual language is clean, modern, and analytical, relying heavily on subtle gradients and precise lines to convey complexity.
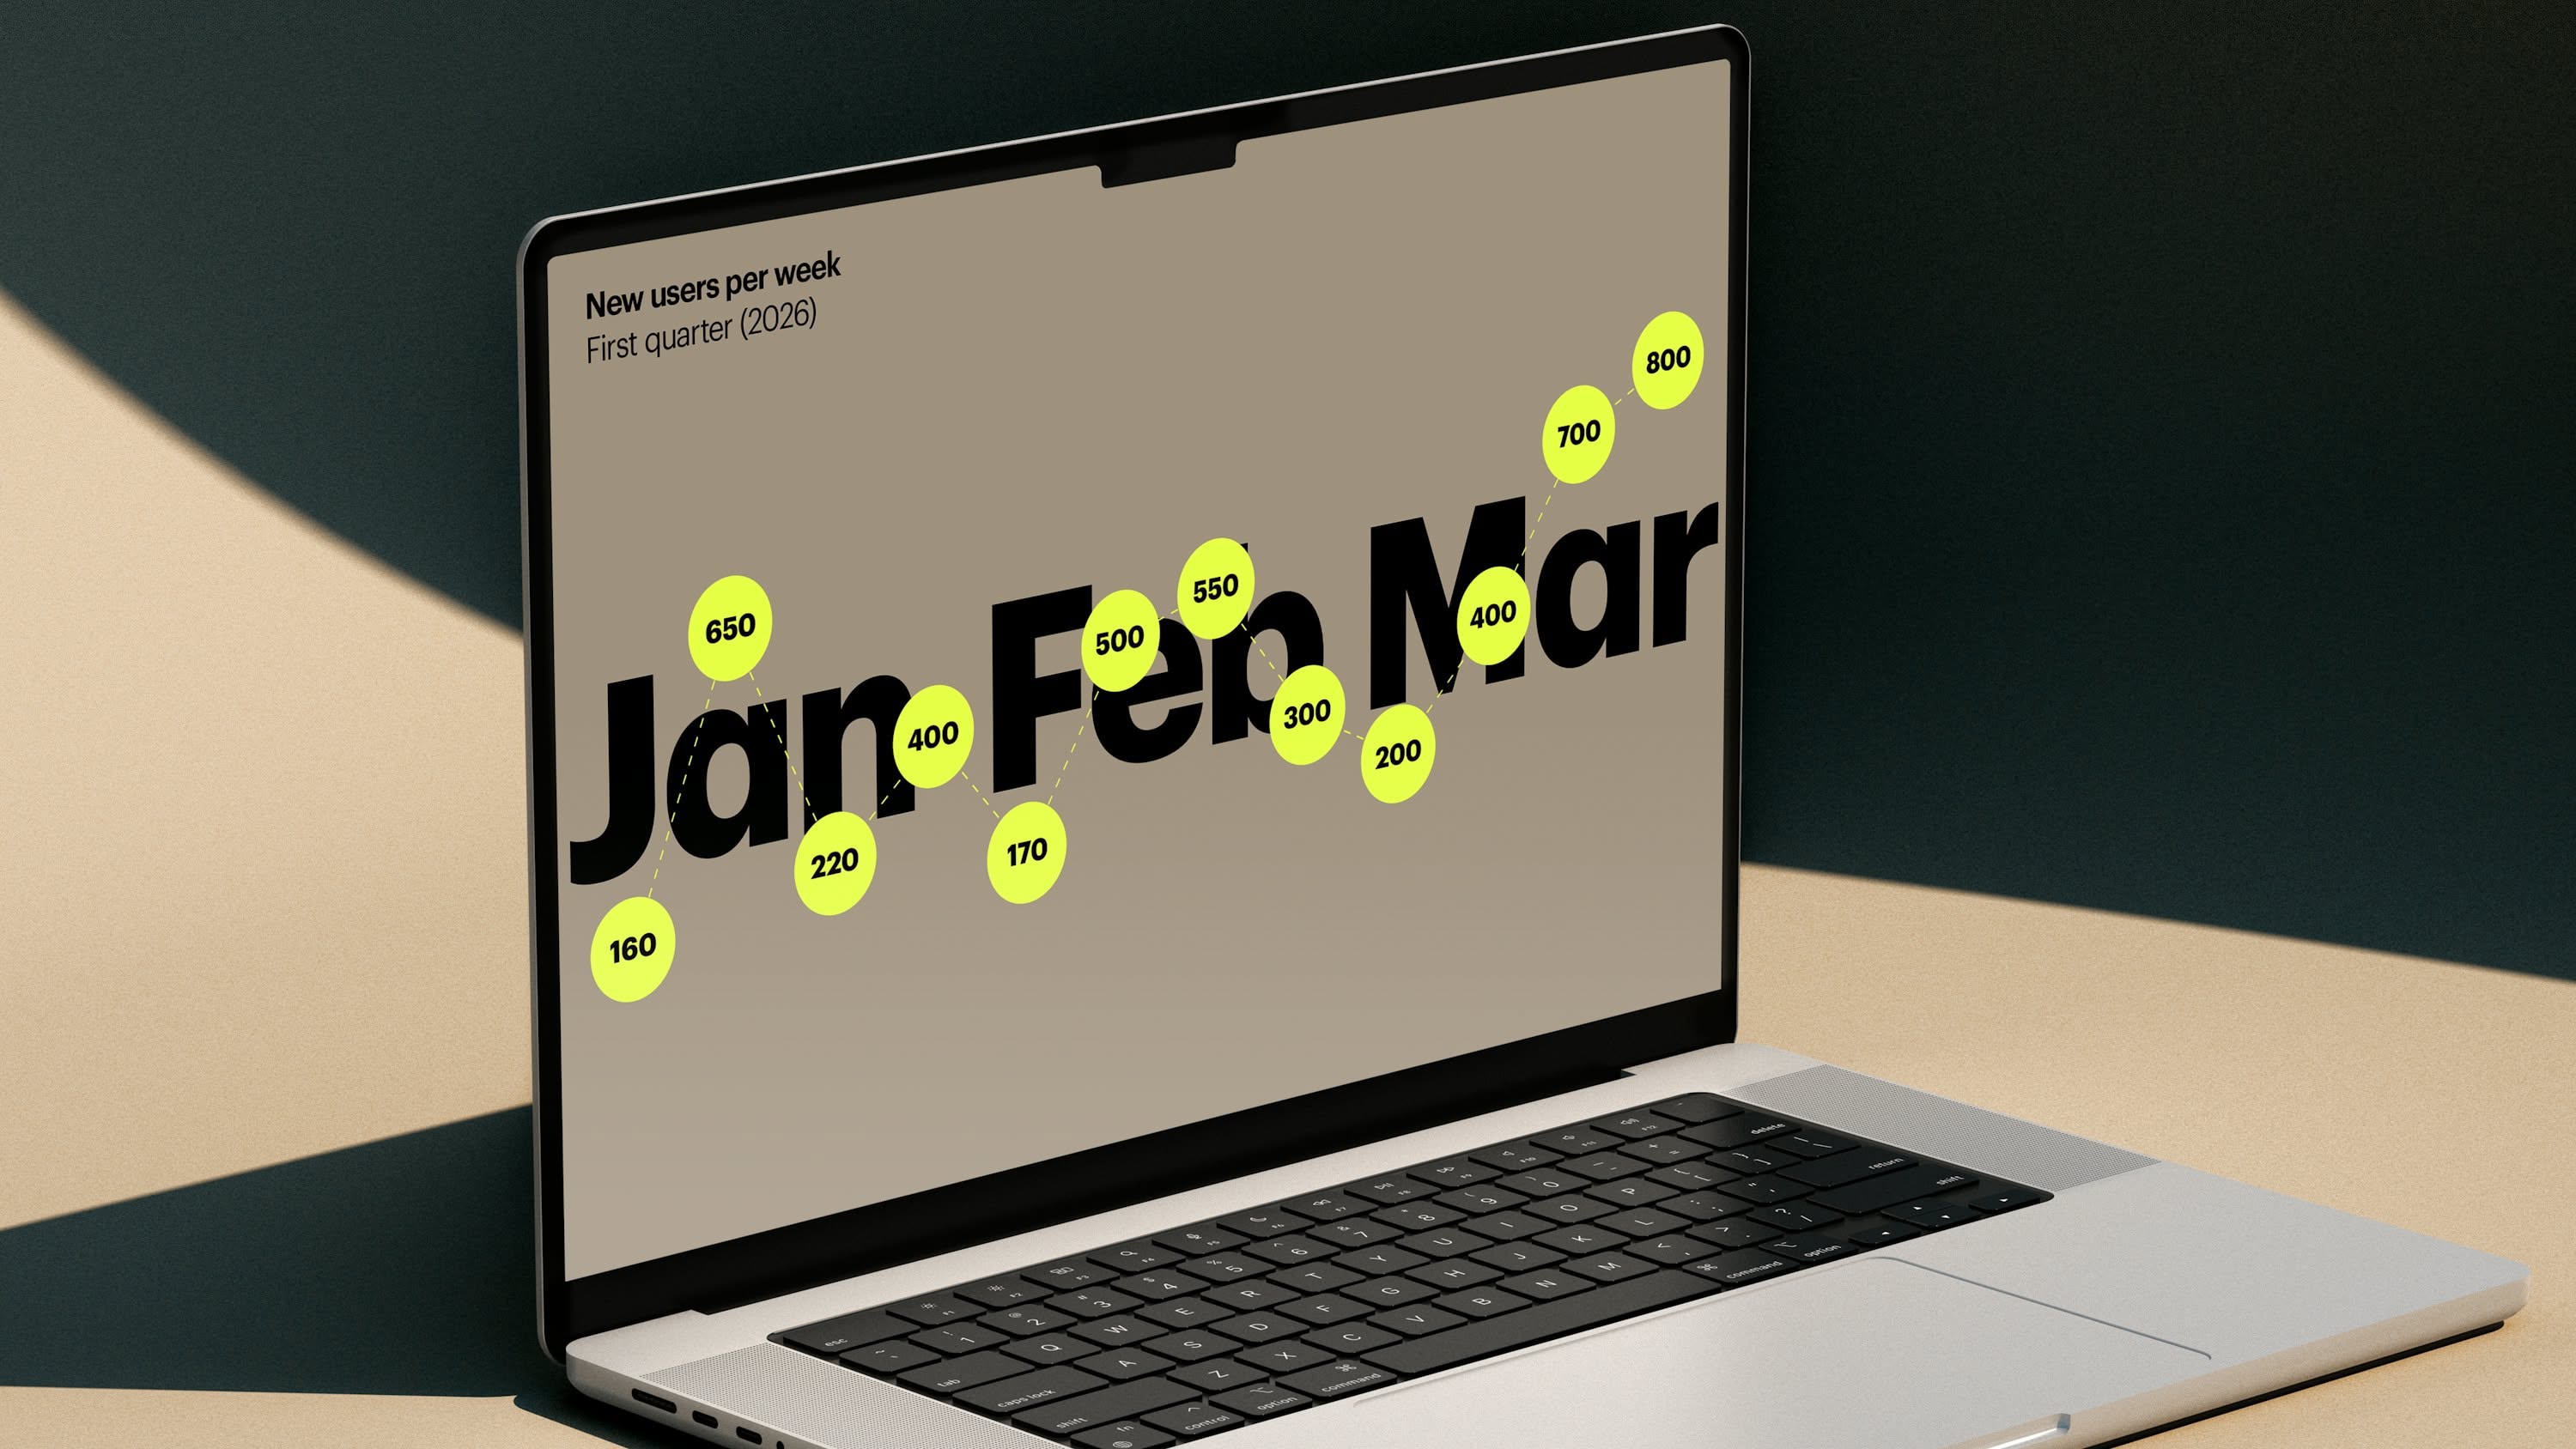
The image presents a clean, modern interface design featuring a large, bold title overlaid with circular data points, suggesting a focus on metrics or user engagement tracking. The visual language is minimalist and data-driven, utilizing high contrast between the dark background and bright text/markers.
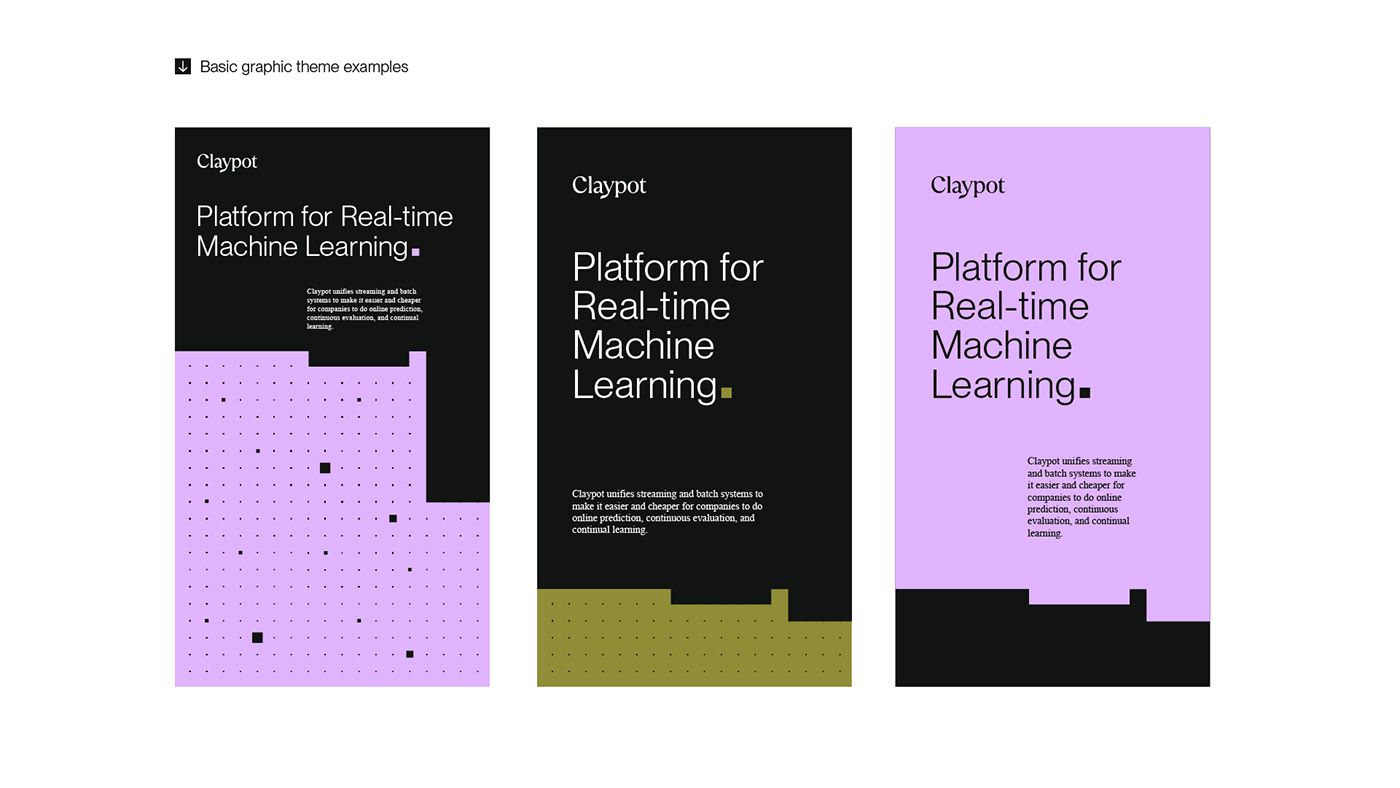
The image displays three distinct graphic theme examples, characterized by a clean, modern, and minimalist aesthetic using block colors and subtle geometric patterns. The design relies heavily on negative space and strong color blocking to convey a sense of technological sophistication.
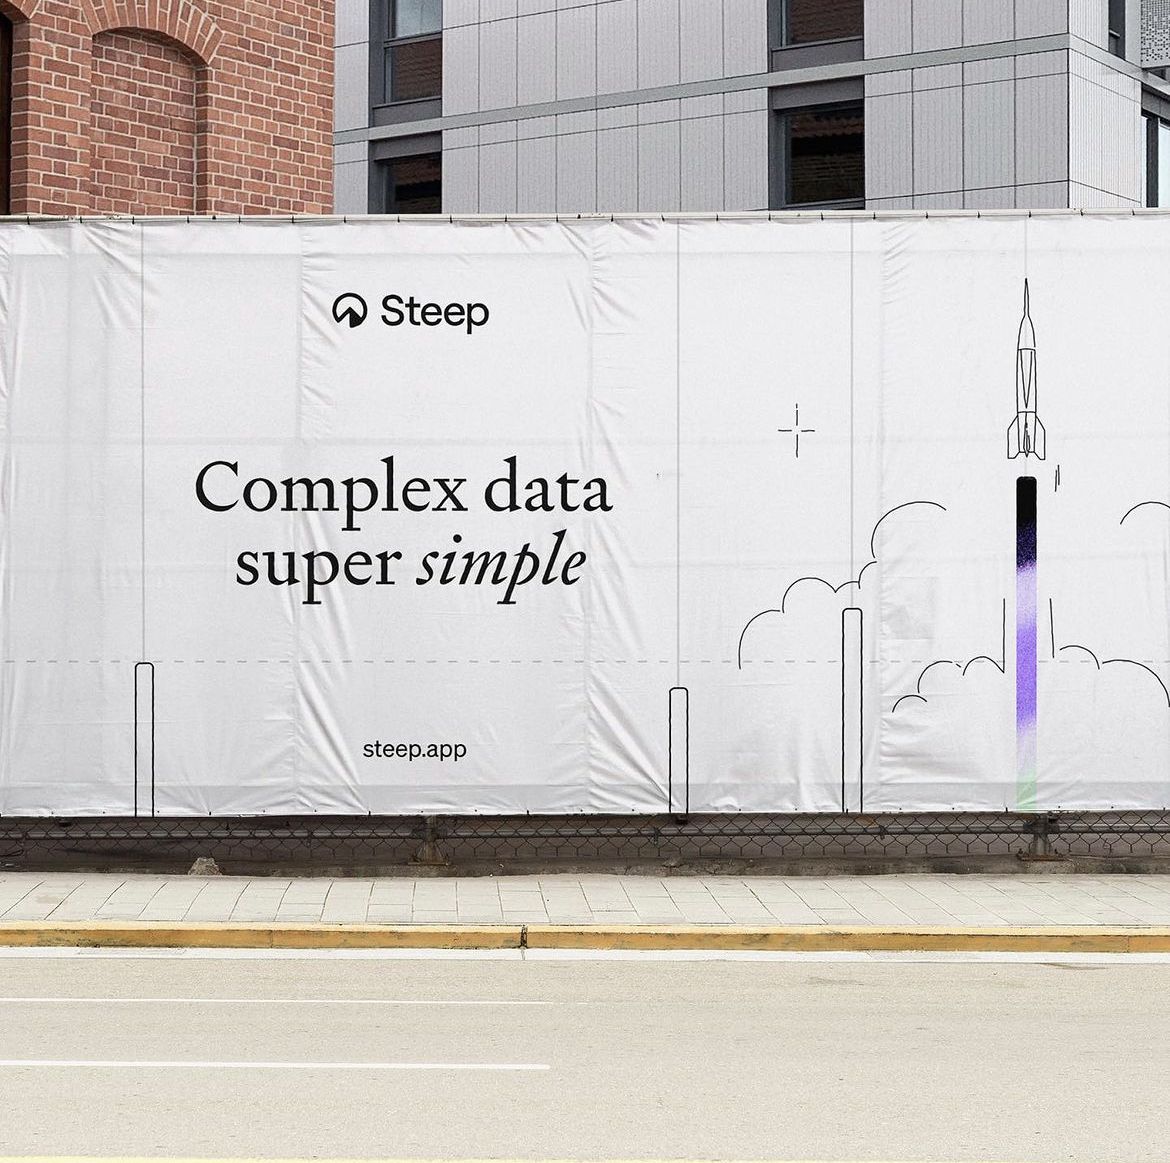
The design is minimalist and clean, utilizing a stark white background to emphasize the core message. It employs simple line art illustrations alongside clear, modern typography to convey a sense of technical simplicity and innovation.
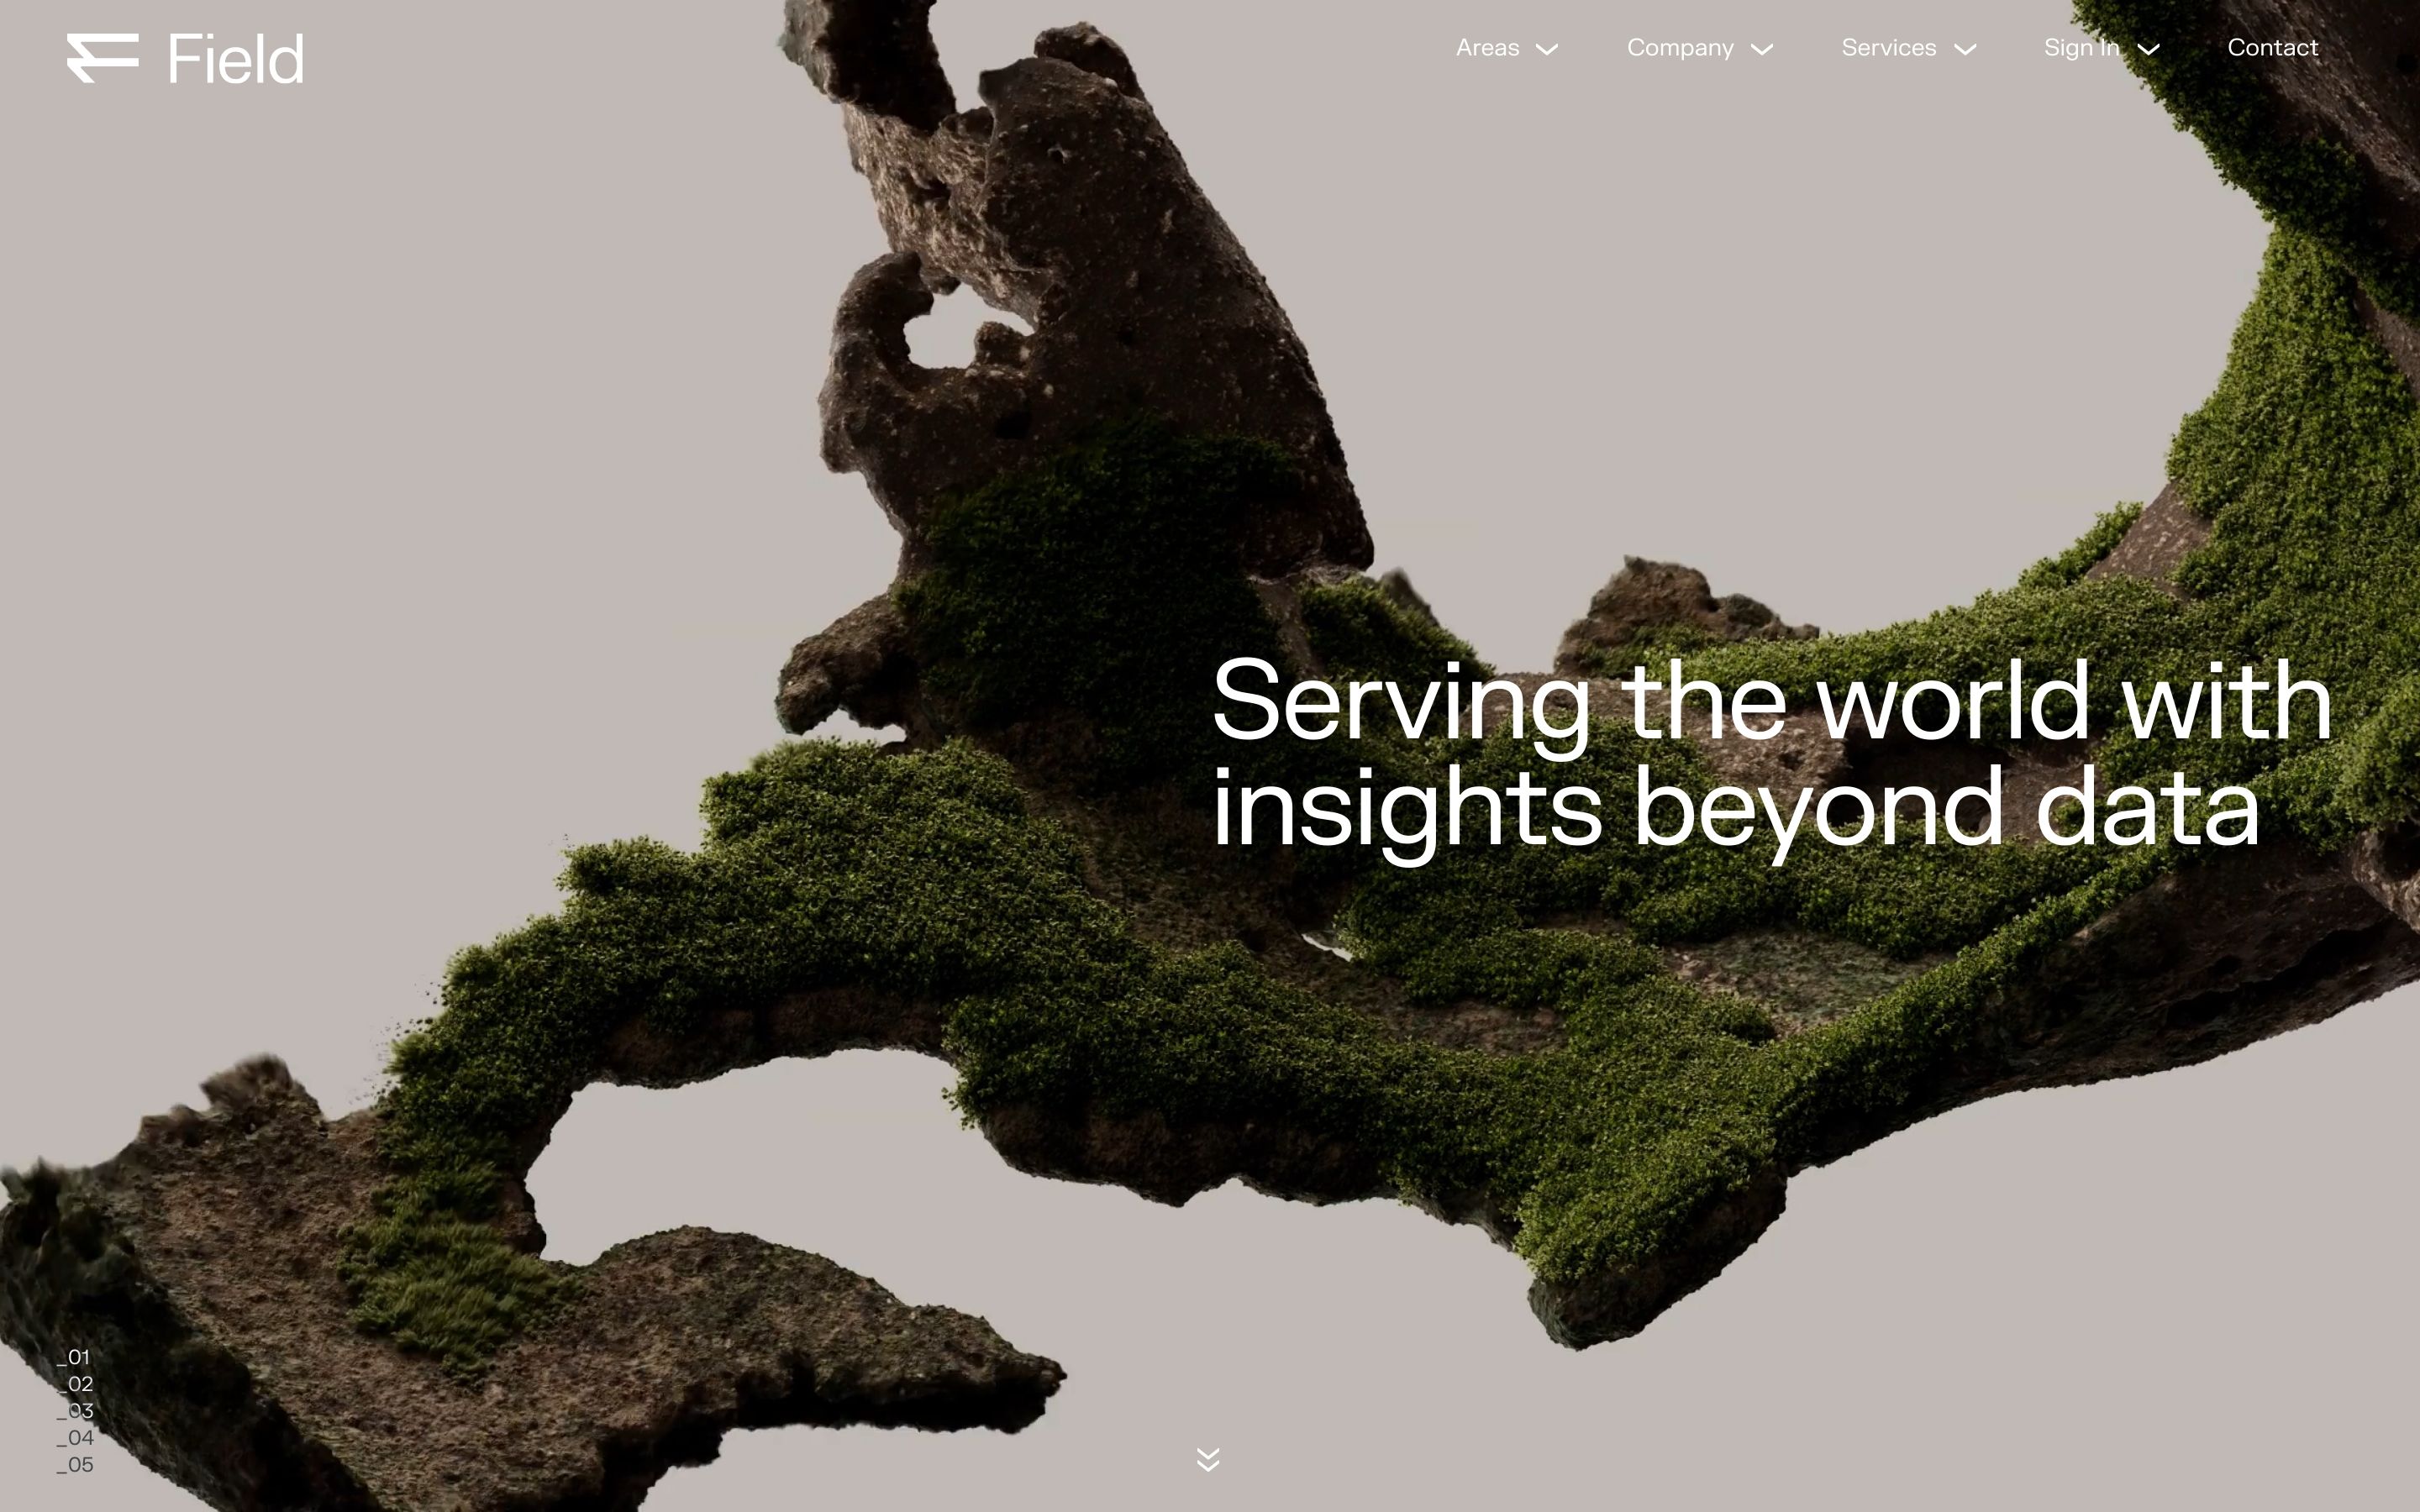
The image features a dark, organic texture resembling moss-covered rock or ancient wood, providing a rich, natural backdrop for clean, modern typography. The design balances rugged, earthy elements with sophisticated, minimalist text to convey depth and expertise.
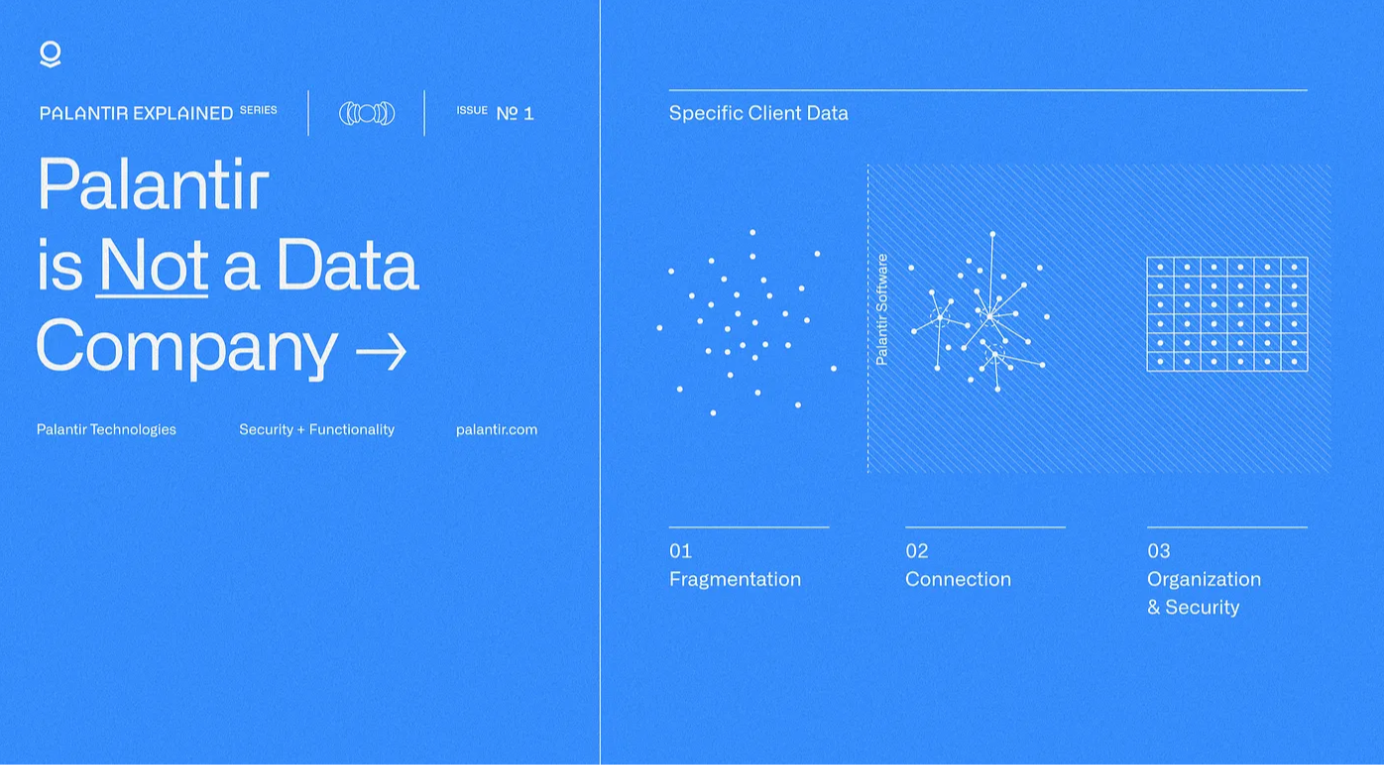
The design is clean, modern, and professional, utilizing a cool blue palette to convey trust and technical expertise. It employs ample white space (or negative space in this case, light blue background) and simple geometric icons to illustrate complex concepts related to data fragmentation and security.
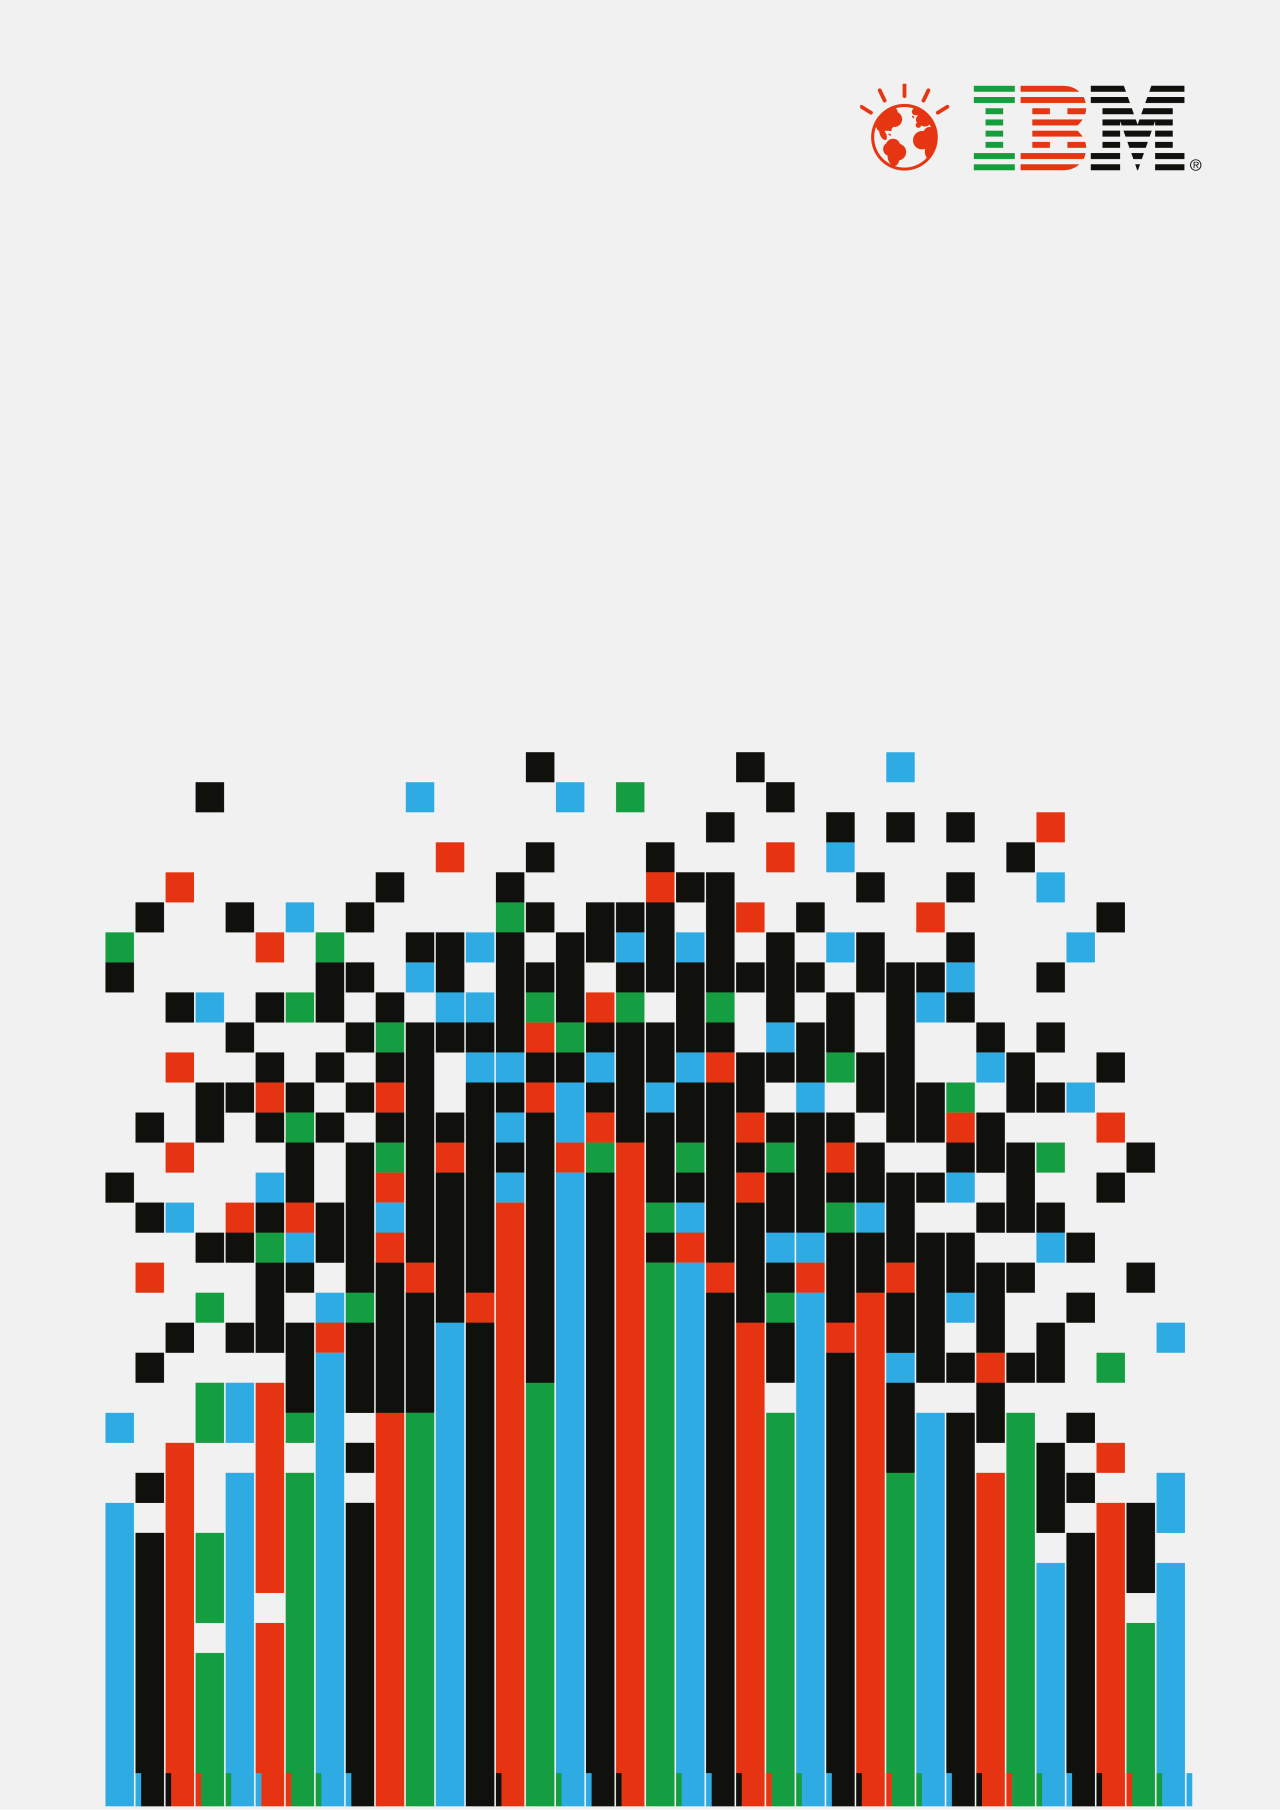
The image is a dense, abstract composition resembling a vertical bar chart or data visualization rendered in a pixelated or blocky style. It uses a high-contrast, multicolored arrangement of vertical elements that create a sense of texture and dynamic upward movement.