data analysis
53 designs
Showing 24 of 53 (53 total)
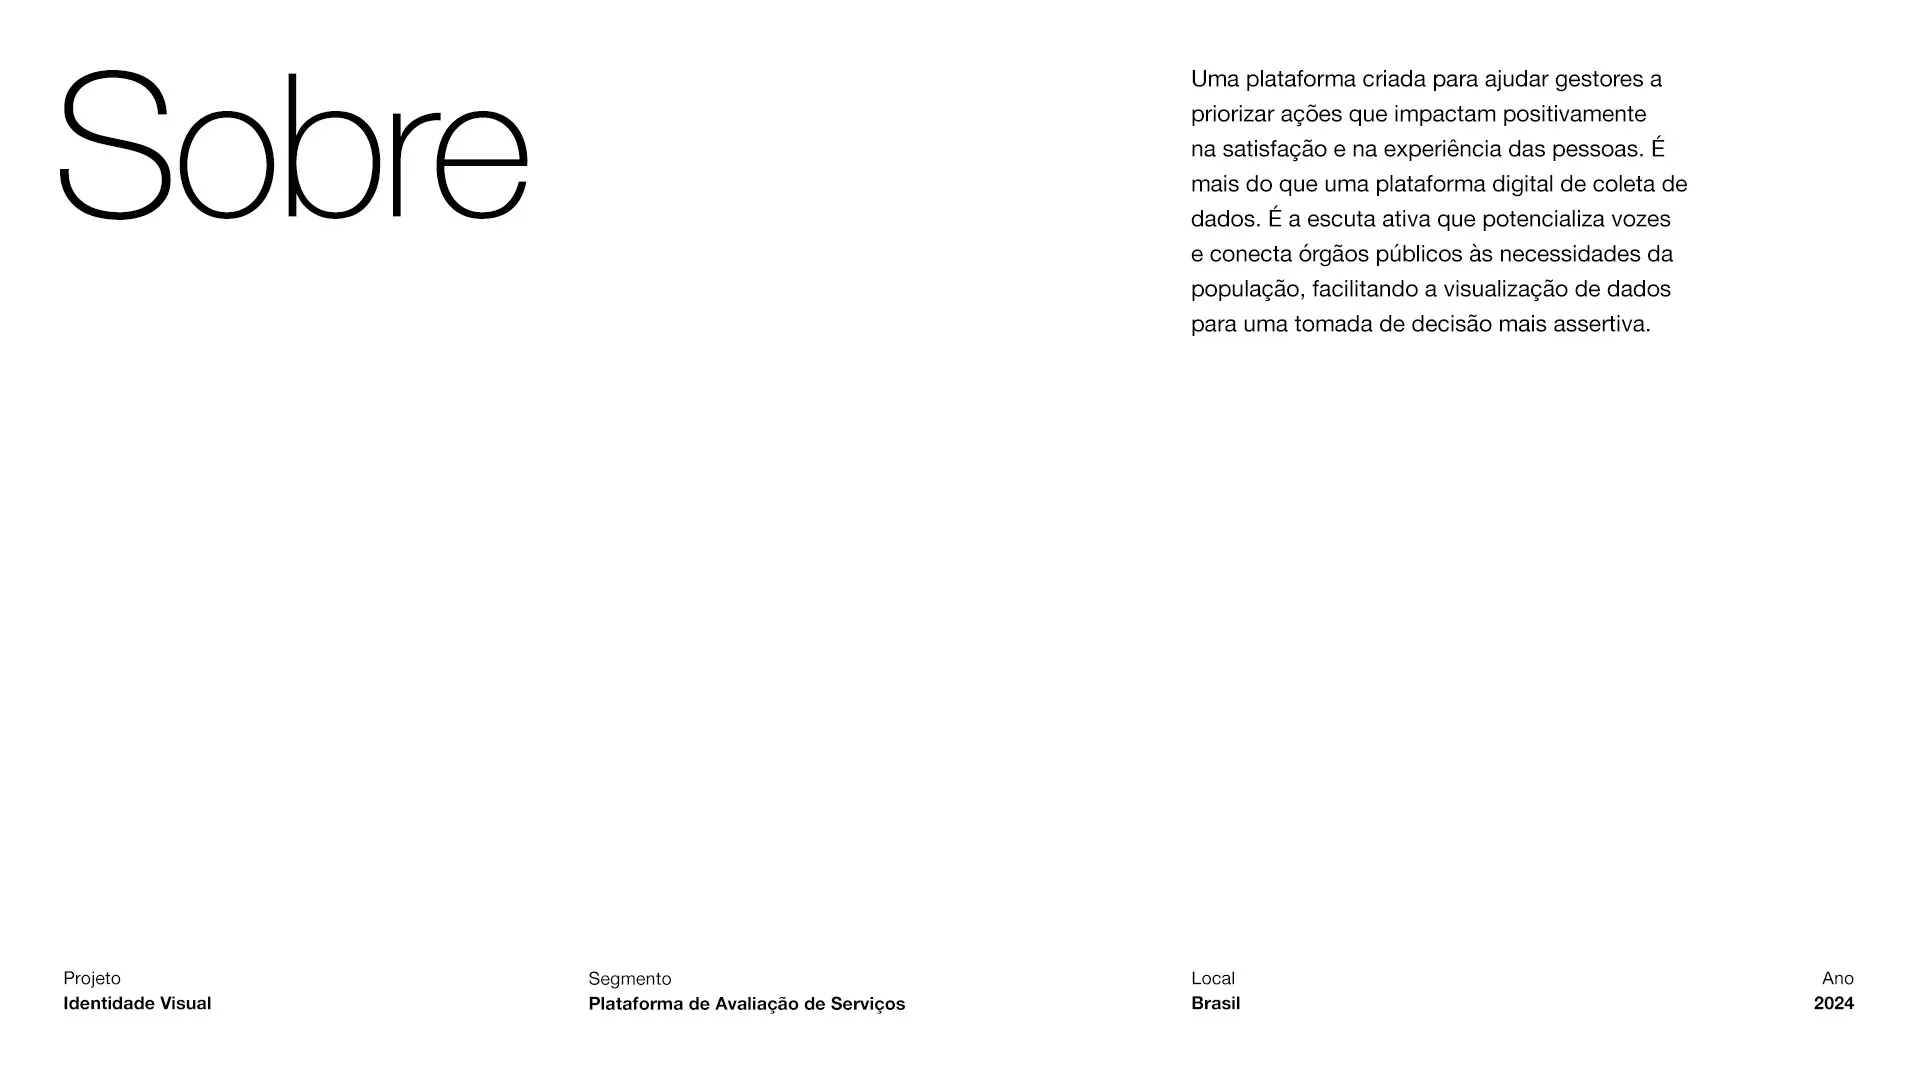
This design employs a stark, minimalist approach characterized by high contrast and generous negative space to emphasize clarity and professionalism. The visual language is clean and direct, focusing entirely on the textual information provided.
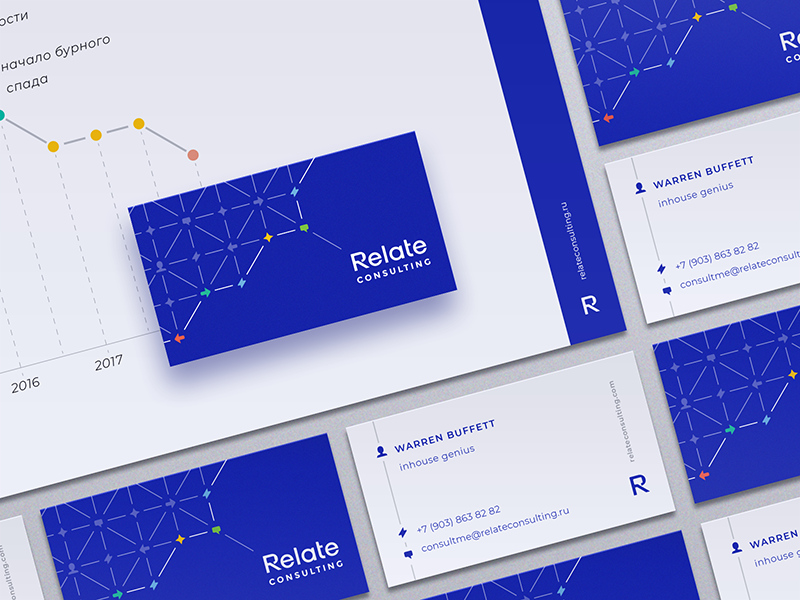
This design utilizes a clean, modern aesthetic centered around data visualization and corporate branding. The visual language relies heavily on geometric patterns and a cool blue palette to convey professionalism and analytical depth. The composition is highly structured, using card layouts and subtle gradients to organize complex information clearly.
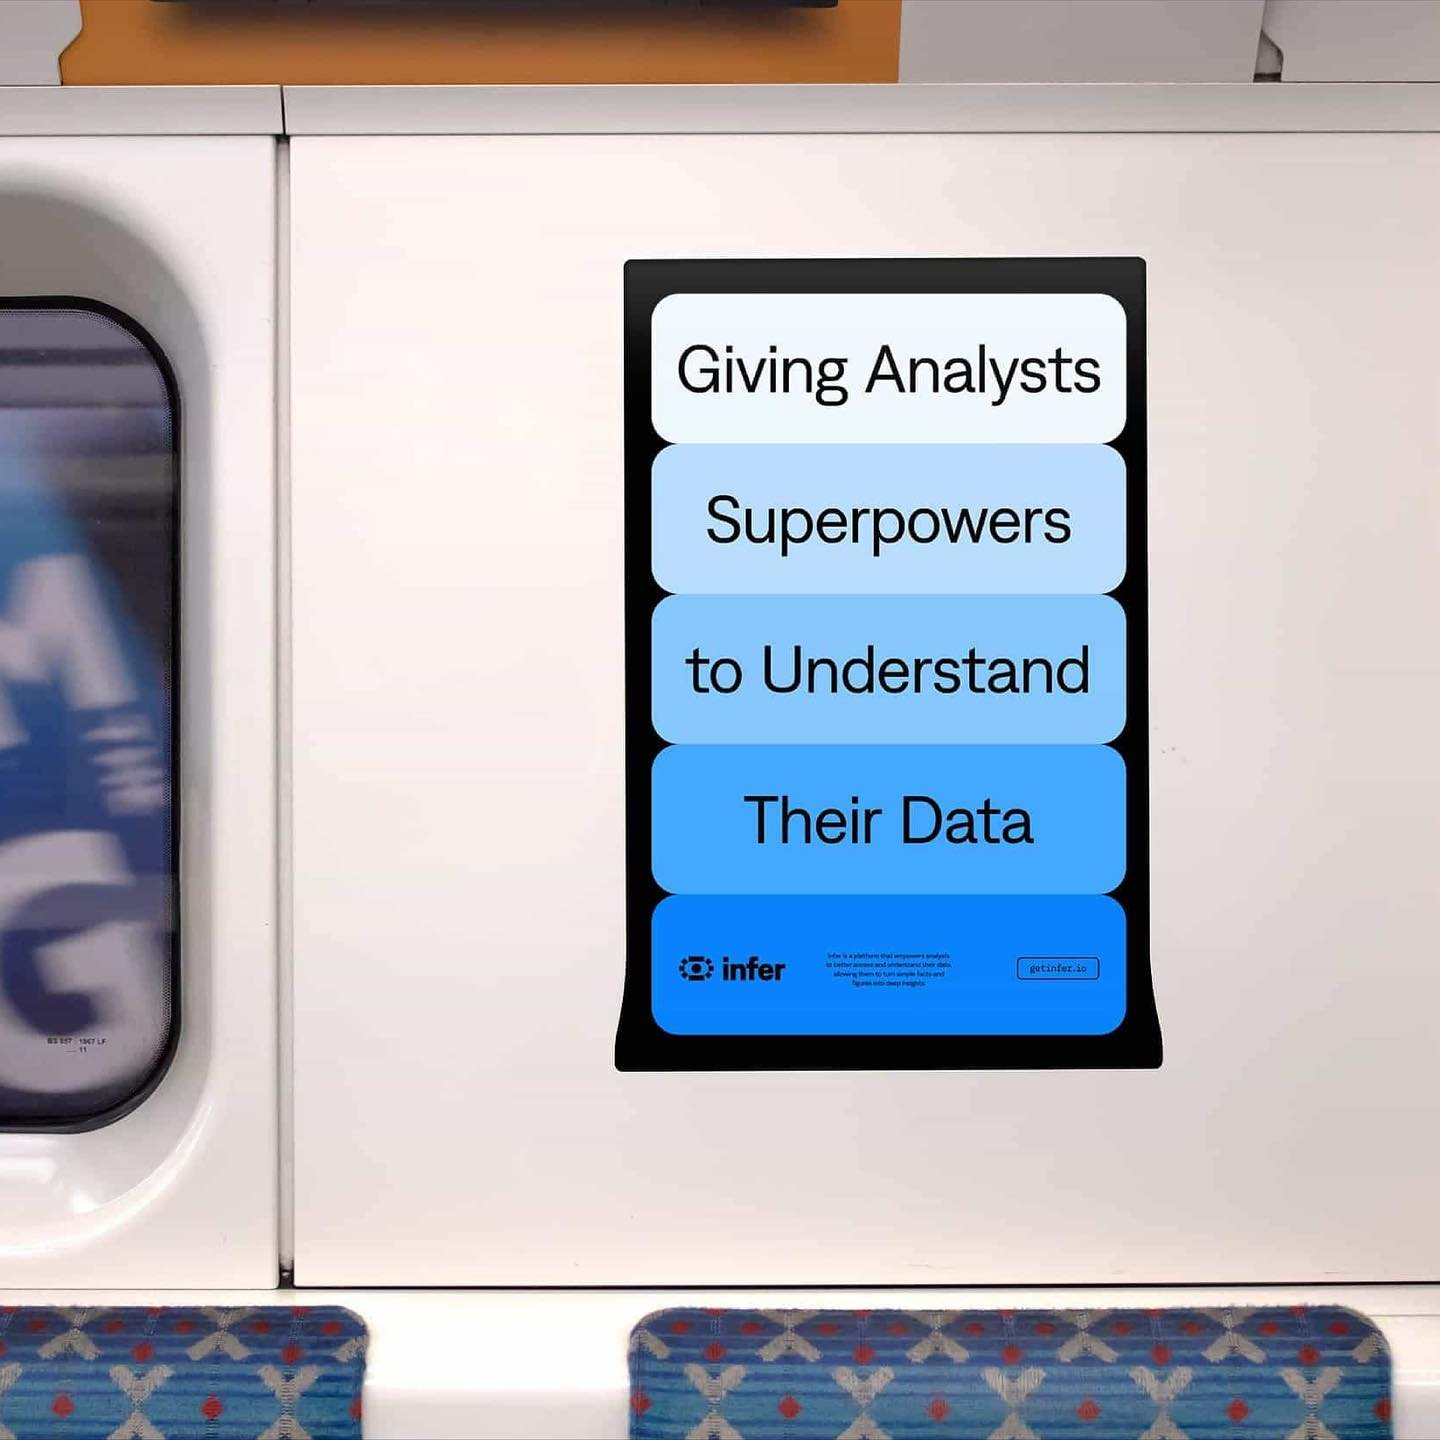
The image displays a clean, minimalist user interface design presented on a white panel, featuring a vertical list of informational buttons with light blue backgrounds and dark text. The design emphasizes clarity, hierarchy, and a modern, functional aesthetic suitable for data analysis tools.
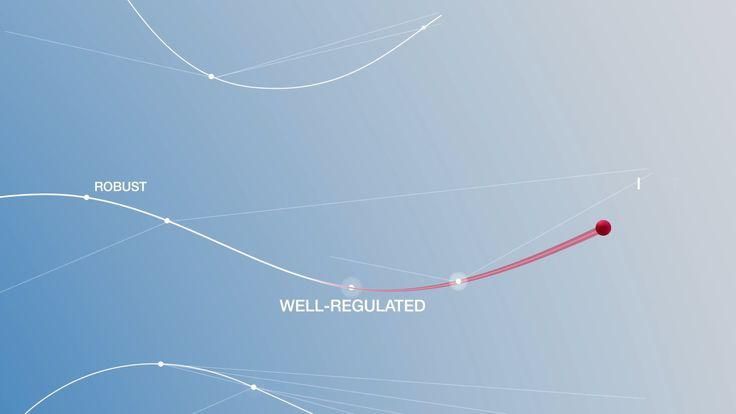
The image presents an abstract, minimalist visualization of a spectrum or continuum, using thin white lines to denote different states (robust to well-regulated). The design is clean and technical, relying on subtle gradients and line work to convey a sense of progression or measurement.
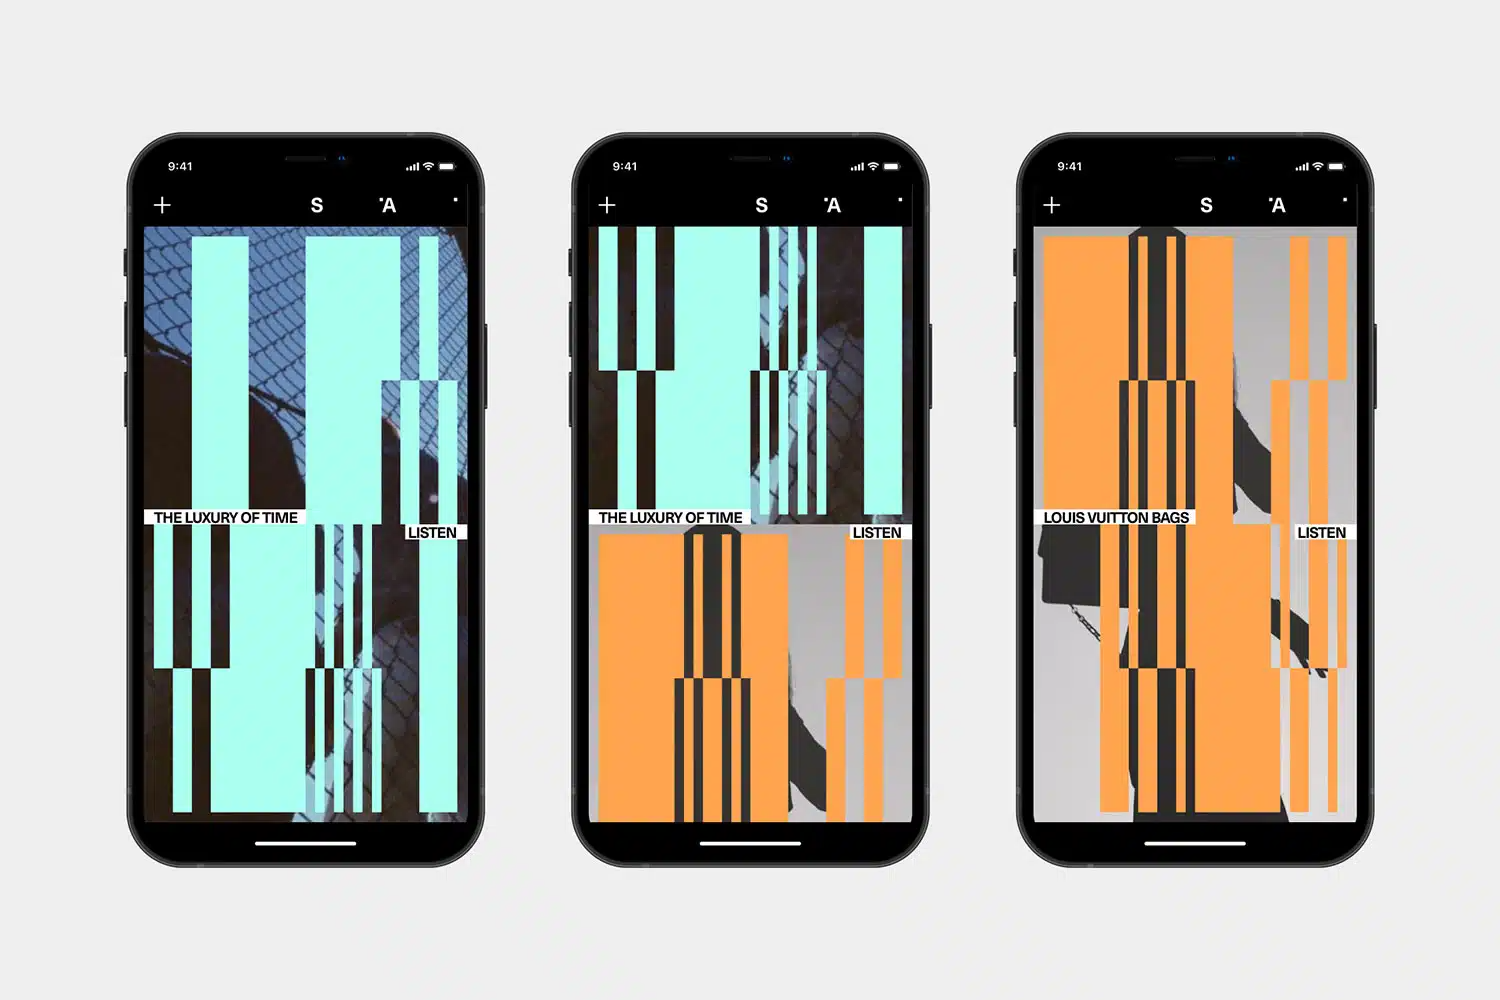
This image presents a series of three smartphone mockups displaying abstract, vertical bar graphics against dark backgrounds. The design utilizes a high-contrast, monochromatic palette dominated by teal/cyan and orange tones to create a modern, data-driven aesthetic.
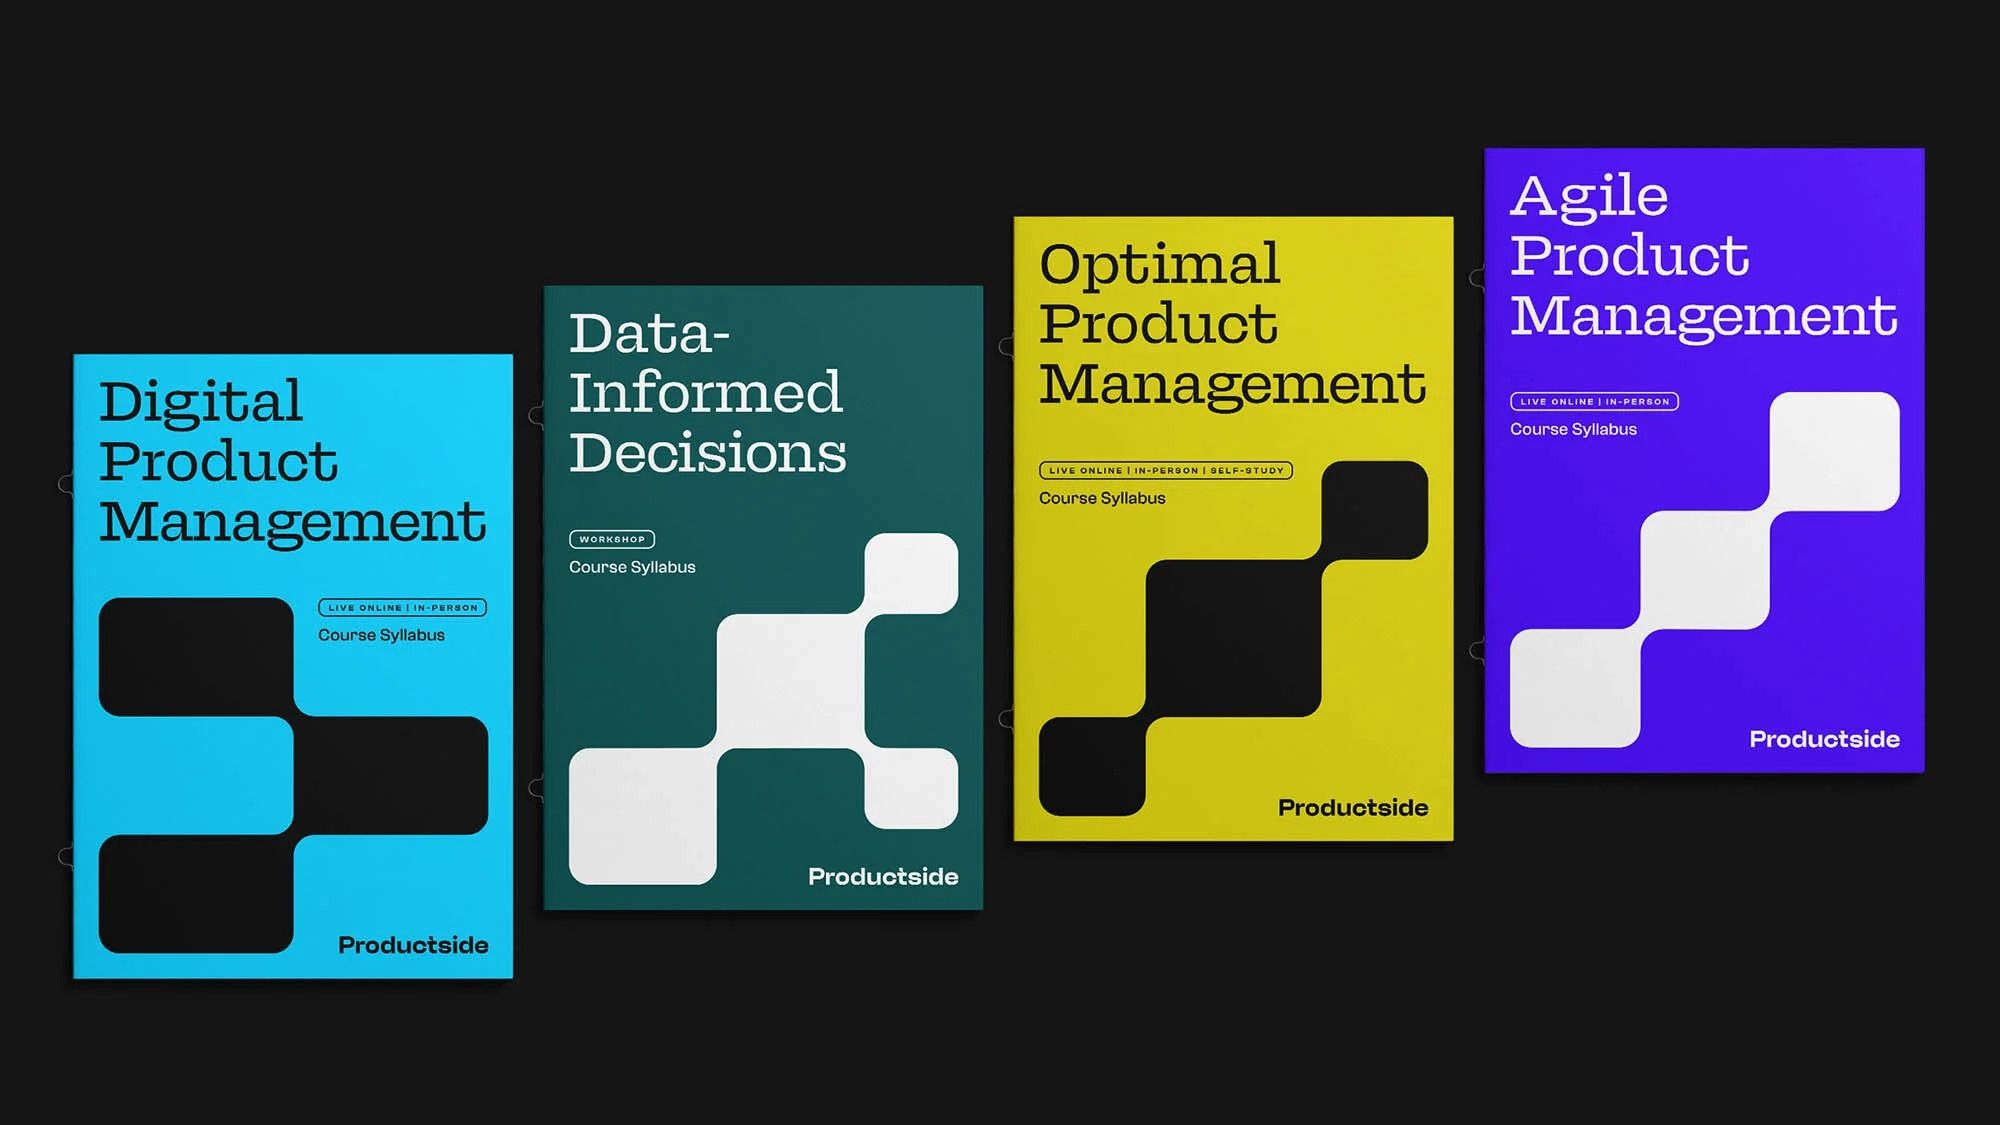
The image presents a clean, modern, and professional set of four distinct visual modules, likely representing different product management concepts. It uses strong geometric shapes and a high-contrast color scheme to create a sense of clarity and structured information.
This image presents a minimalist, structured matrix chart design using simple geometric shapes to represent data points. The visual language is clean and systematic, relying heavily on precise alignment and negative space to convey organization.
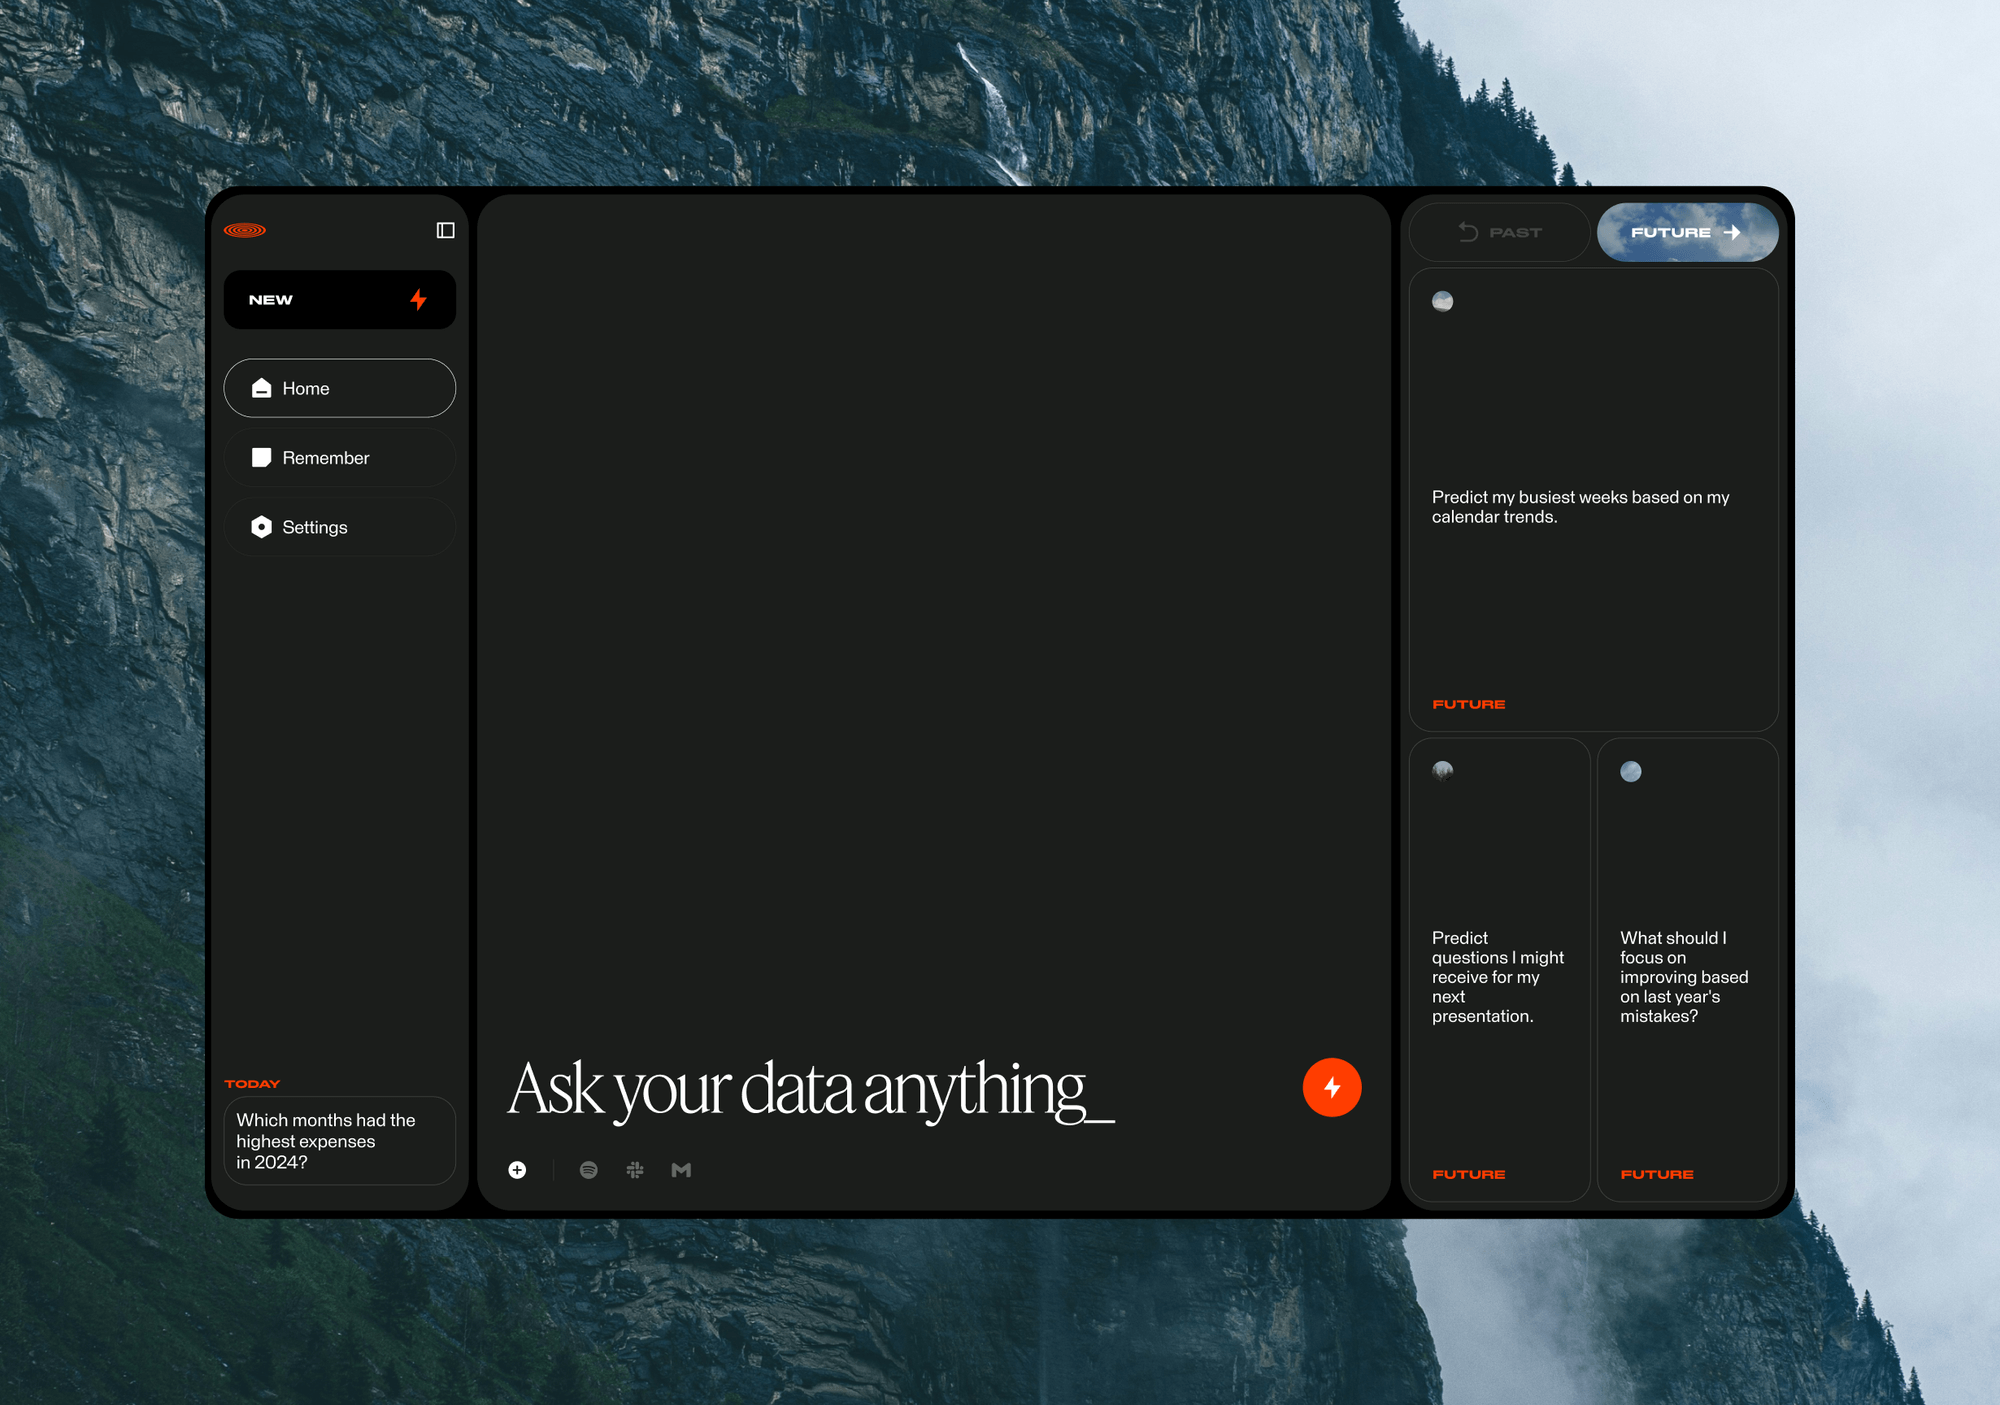
The interface presents a dark mode design with a clean, modern aesthetic, utilizing ample negative space and subtle gradients to convey professionalism and depth. The layout is structured with a sidebar navigation on the left and a main content area, suggesting a sophisticated data or productivity application.
A technical interface screenshot showing a dark software control panel on the left paired with a vibrant 3D data visualization on the right. The design demonstrates professional audio or signal processing software with an isometric bar chart displaying frequency or spectral data in bold primary colors.
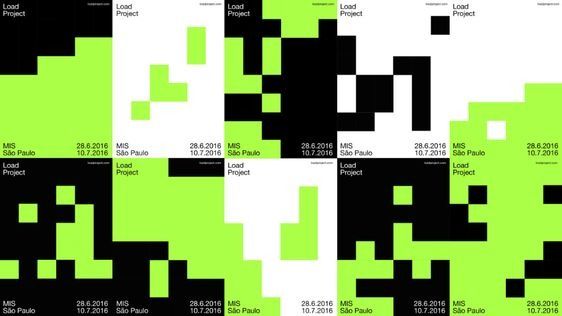
The image presents a grid-like visualization, likely representing data or project status across different categories. It uses a stark binary contrast between black and bright lime green to delineate areas, creating a high-contrast, analytical feel.

The image displays a clean, minimalist user interface (UI) for navigating different data views, characterized by a light blue background and white cards. The design emphasizes clear hierarchy through simple icons and text labels, suggesting a modern and functional application.
The image captures a close-up of a person interacting with a digital interface, likely for data visualization or monitoring, set against a dark background. The visual language is functional and technical, emphasizing data presentation through overlaid graphical elements.
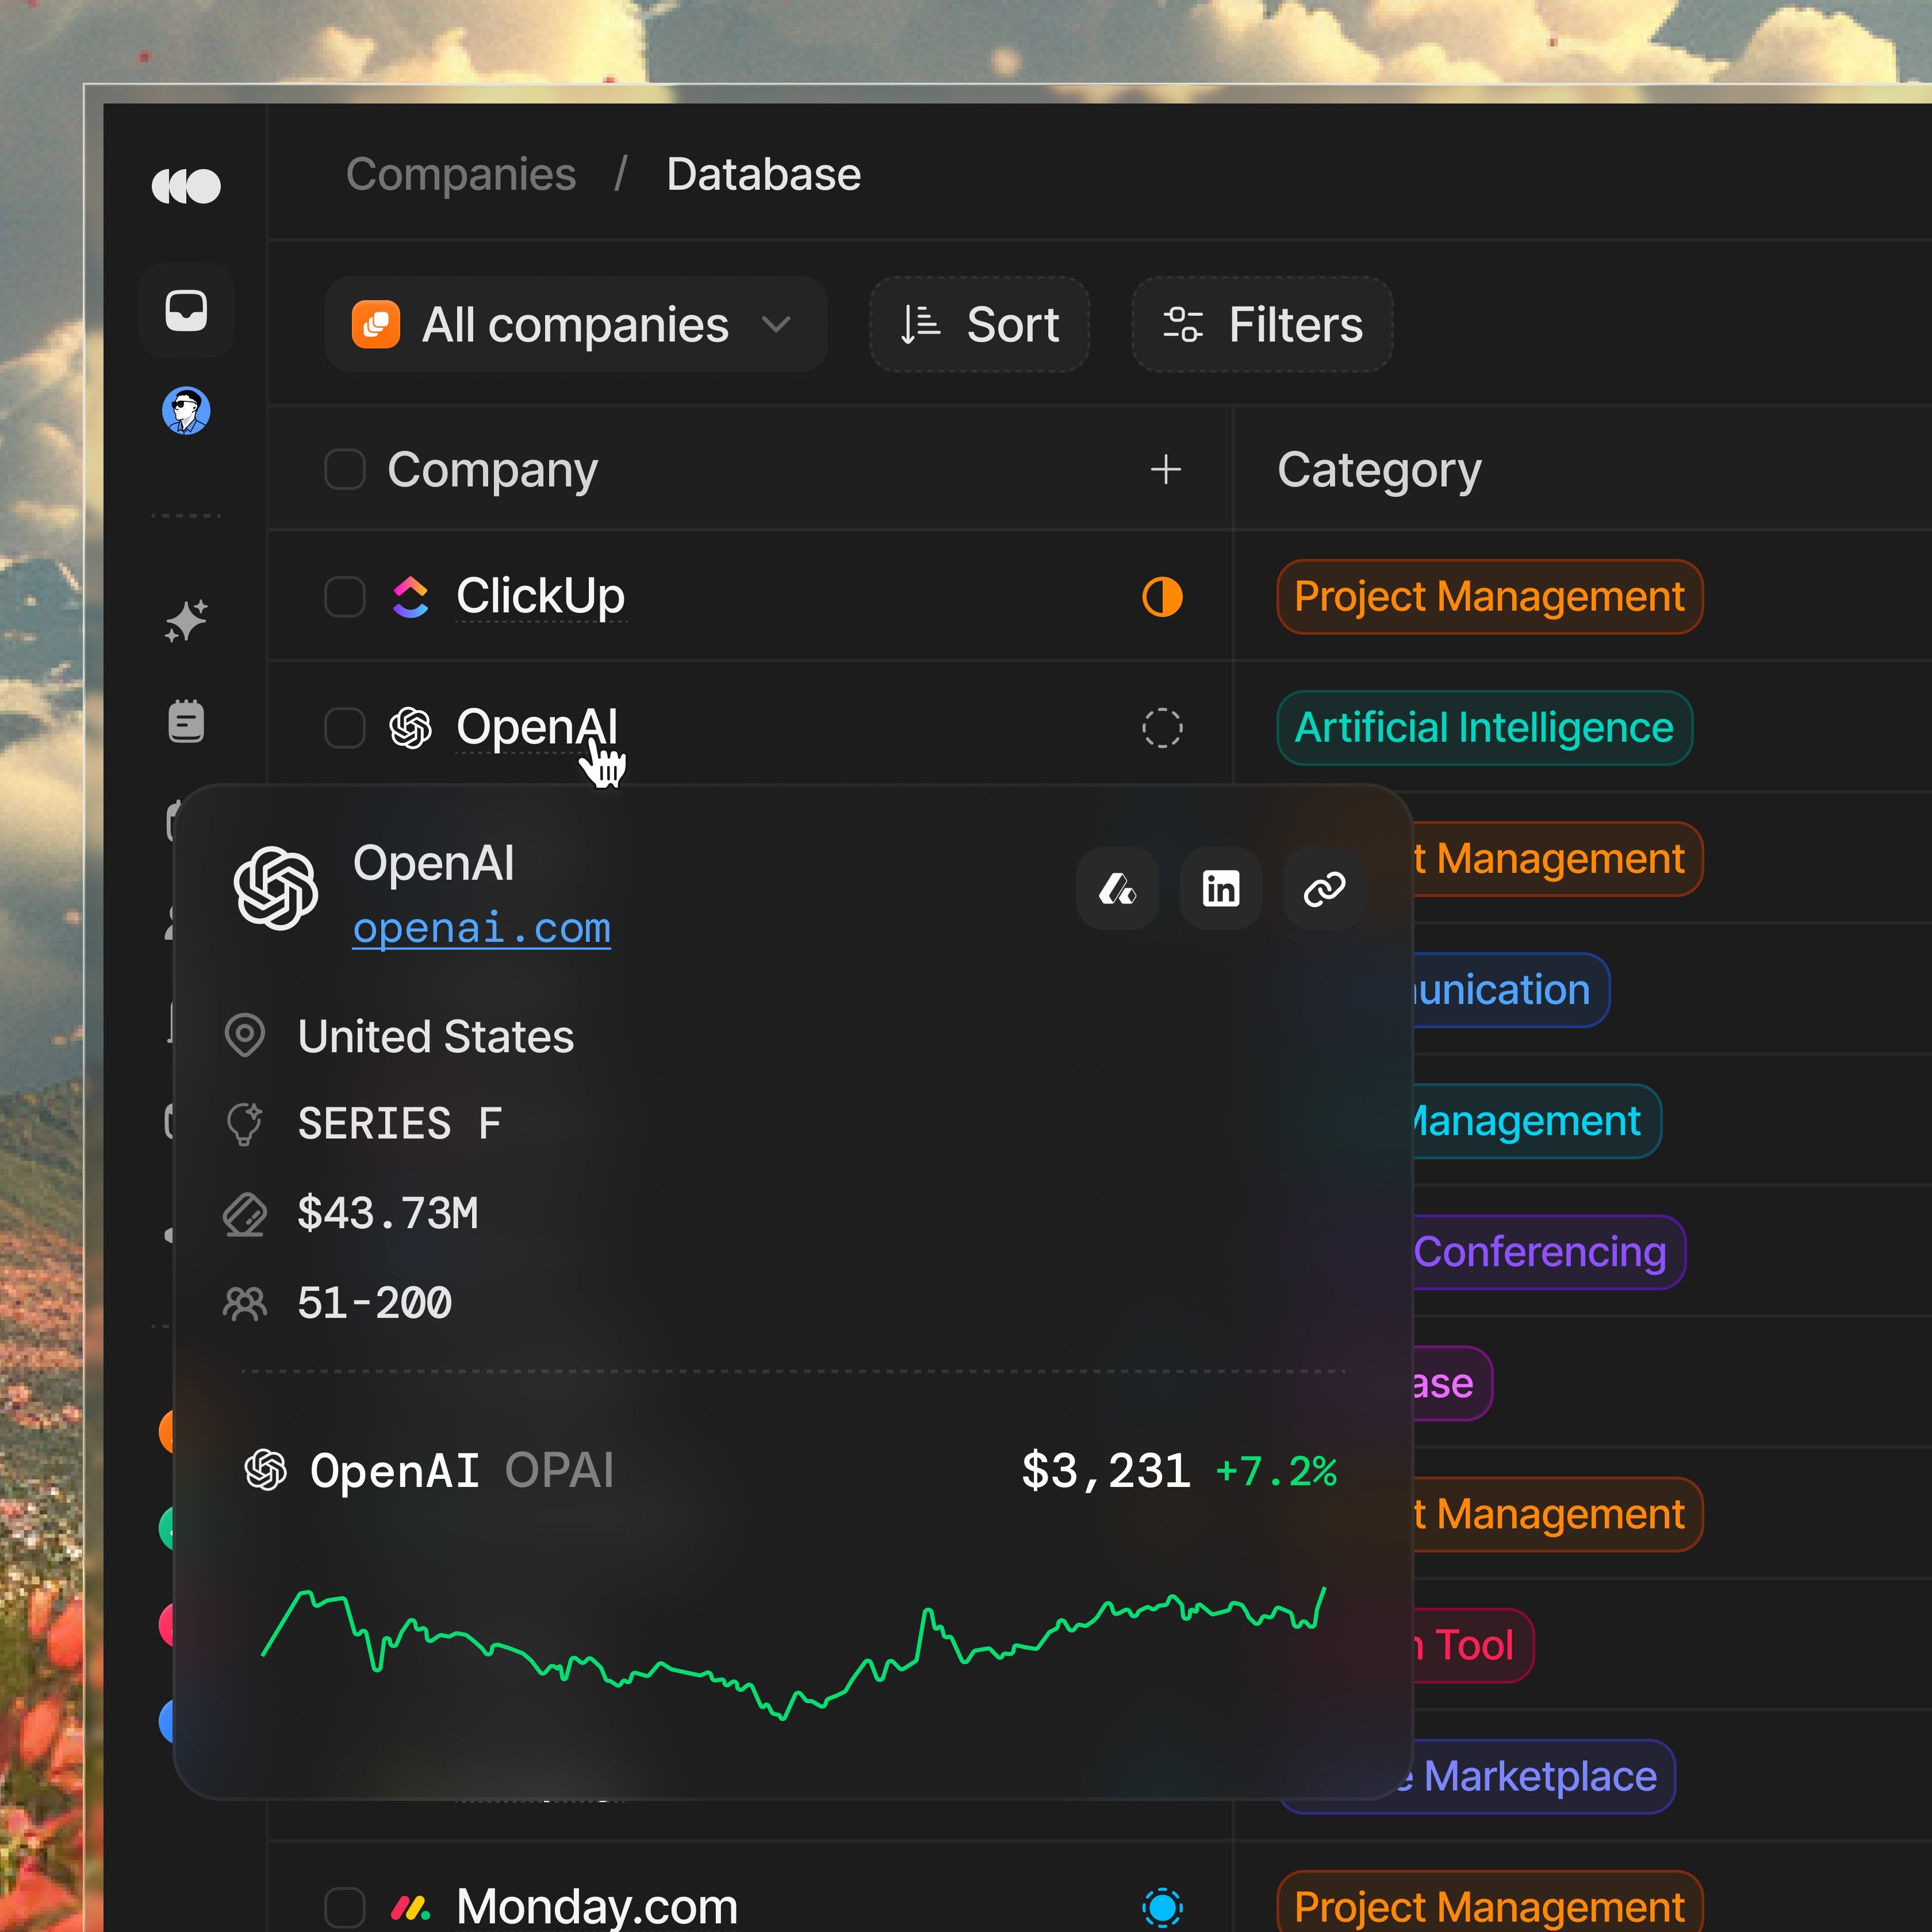
The interface presents a clean, data-driven dashboard layout with a dark mode aesthetic, emphasizing clear categorization and hierarchical information through list views. The design is functional and professional, utilizing subtle color cues to differentiate entities within a structured environment.
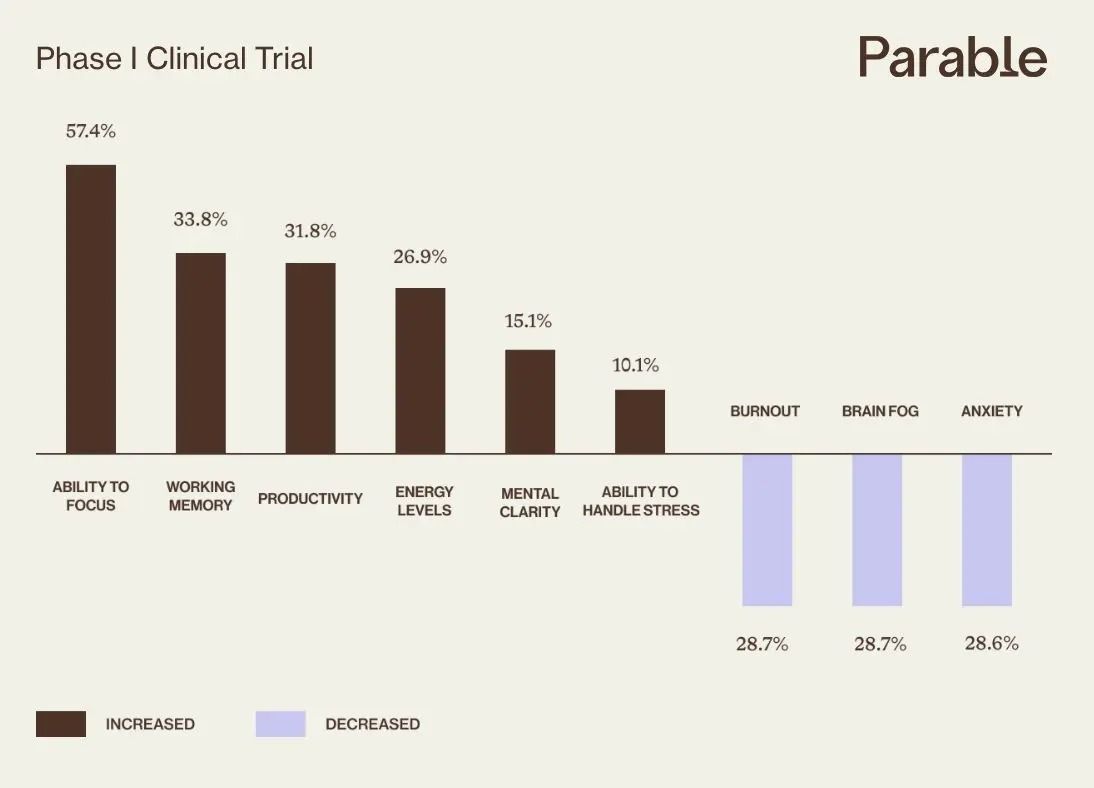
This is a clean, data-driven bar chart presenting clinical trial results for a drug named 'Parable'. The design is minimalist, relying heavily on dark brown bars against a light background to clearly convey quantitative comparisons across various metrics.
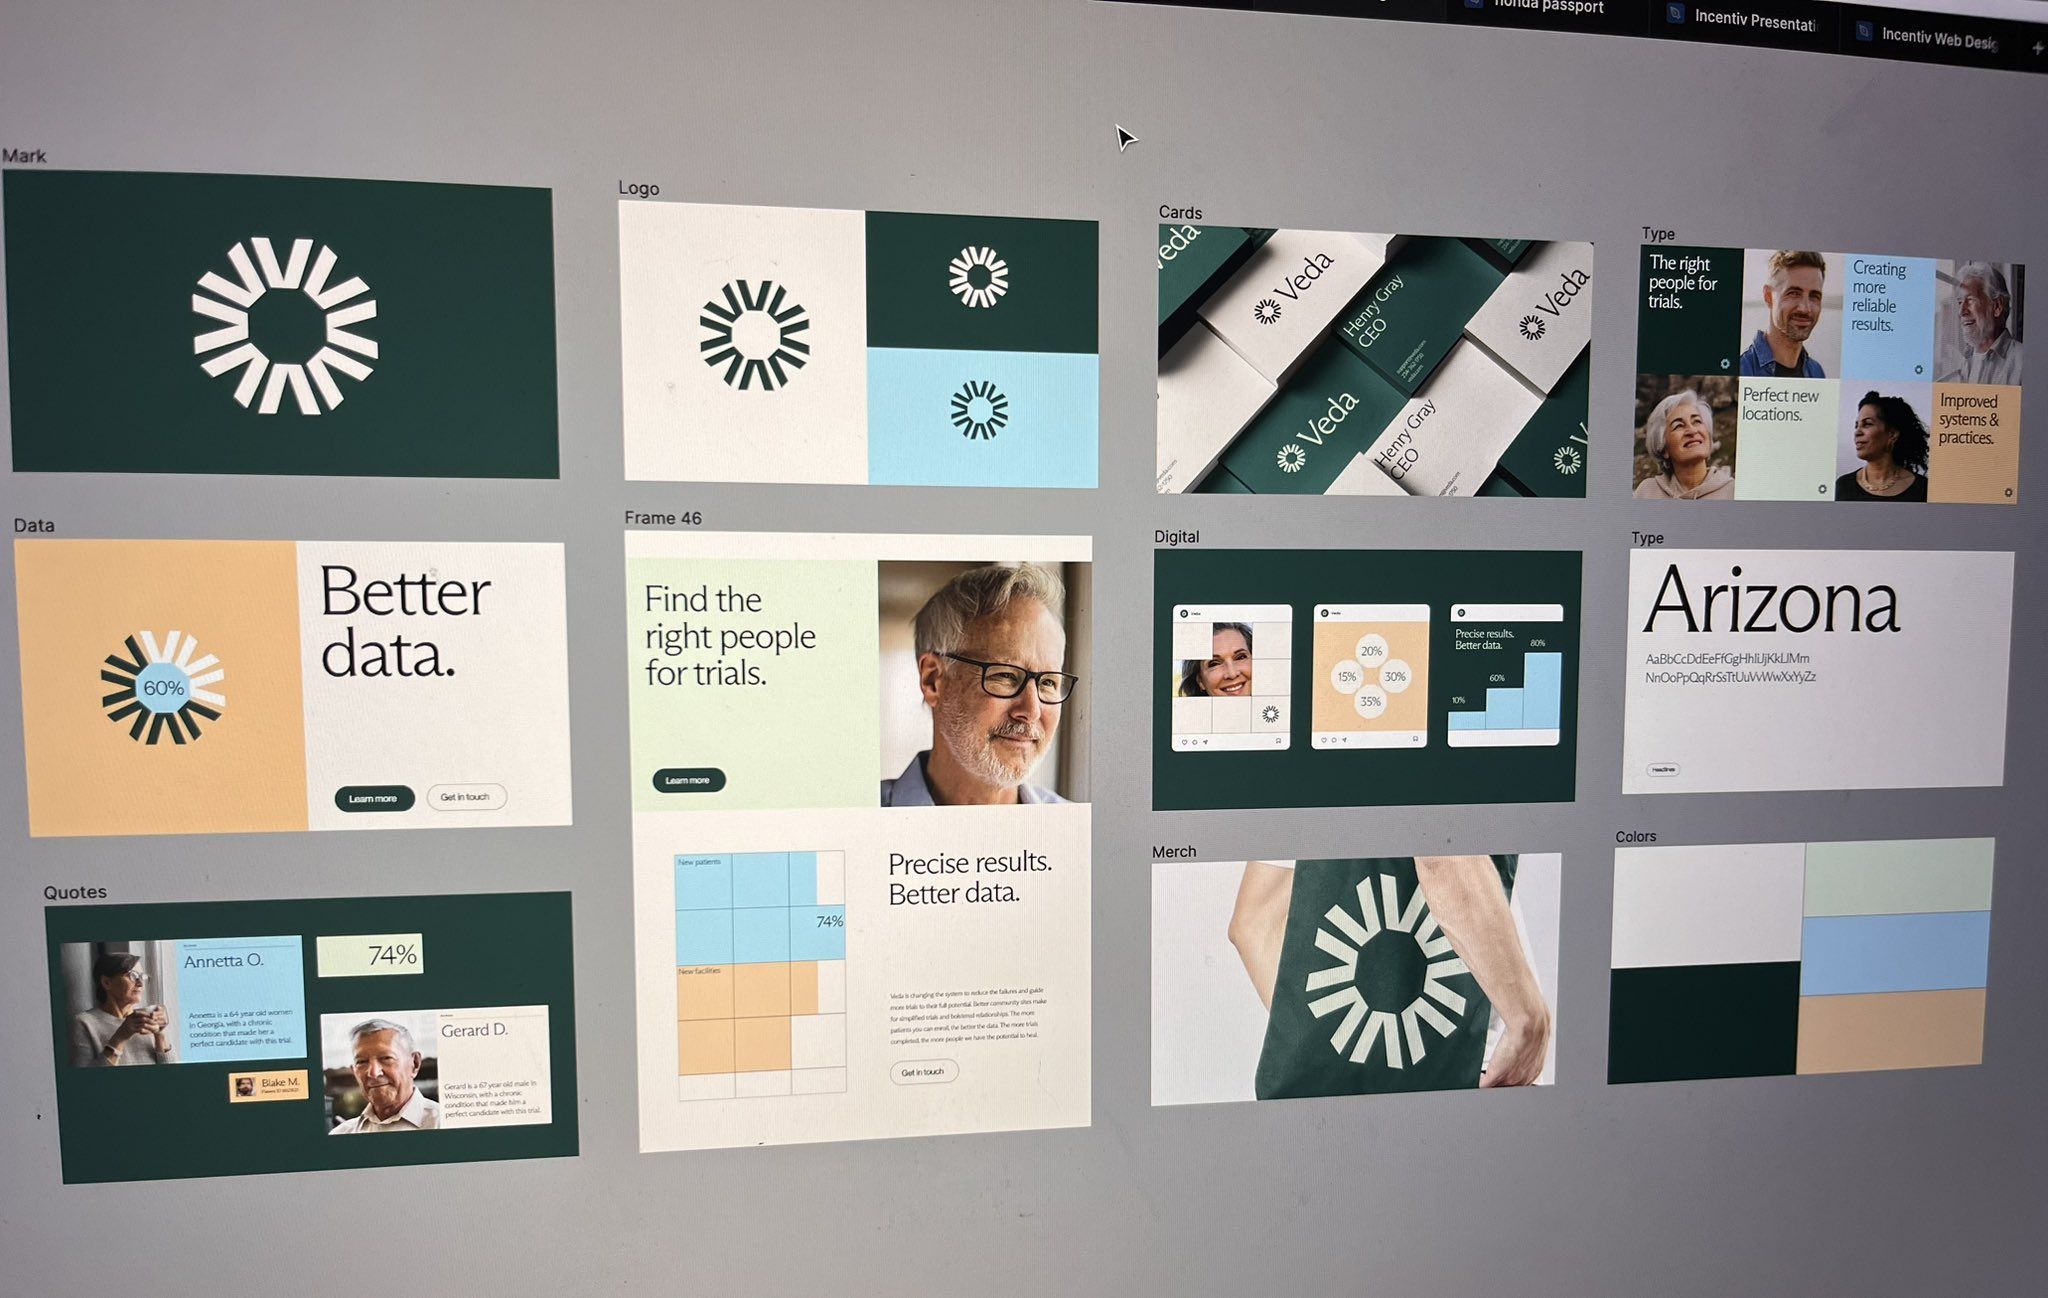
The image displays a collection of clean, modern, and professional-looking presentation slides or mockups, characterized by a dark green and white color scheme. The design emphasizes clear data visualization and straightforward information hierarchy, suggesting a focus on analytical or business reporting.
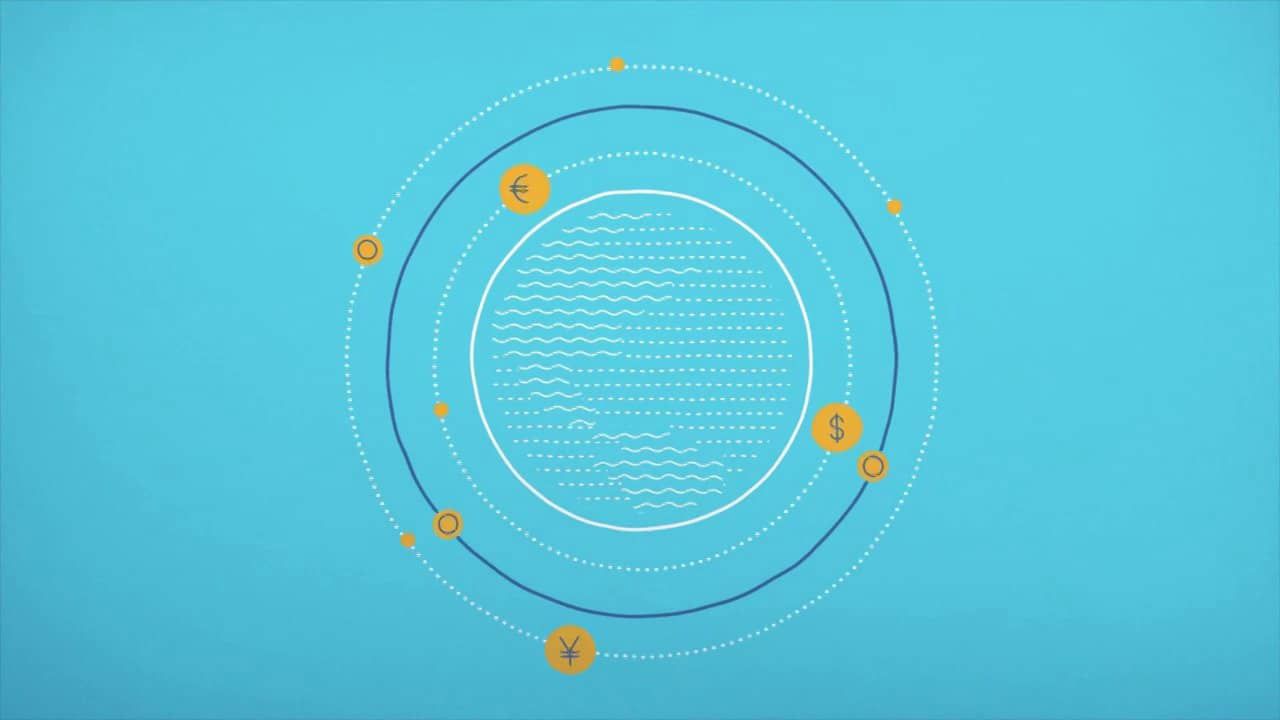
This is an abstract, circular infographic design utilizing concentric rings and dotted lines to represent concepts, likely related to finance or data flow. The clean lines and light blue background create a modern, organized, and somewhat technical visual language.
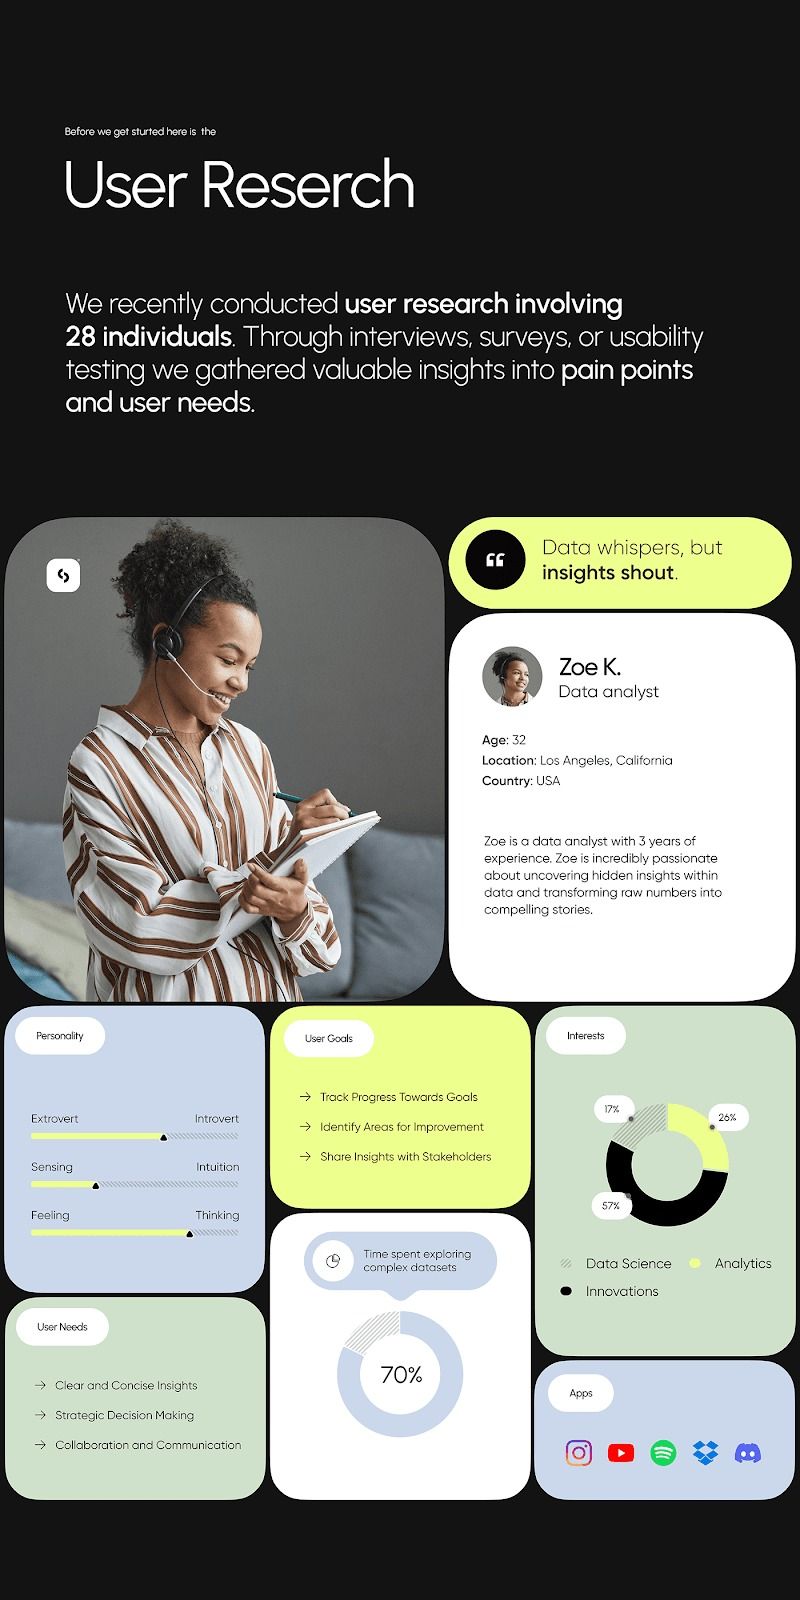
The design presents a clean, modern, and professional interface focused on presenting user research findings. It utilizes ample white space and a muted color palette to create a sense of clarity and trustworthiness.
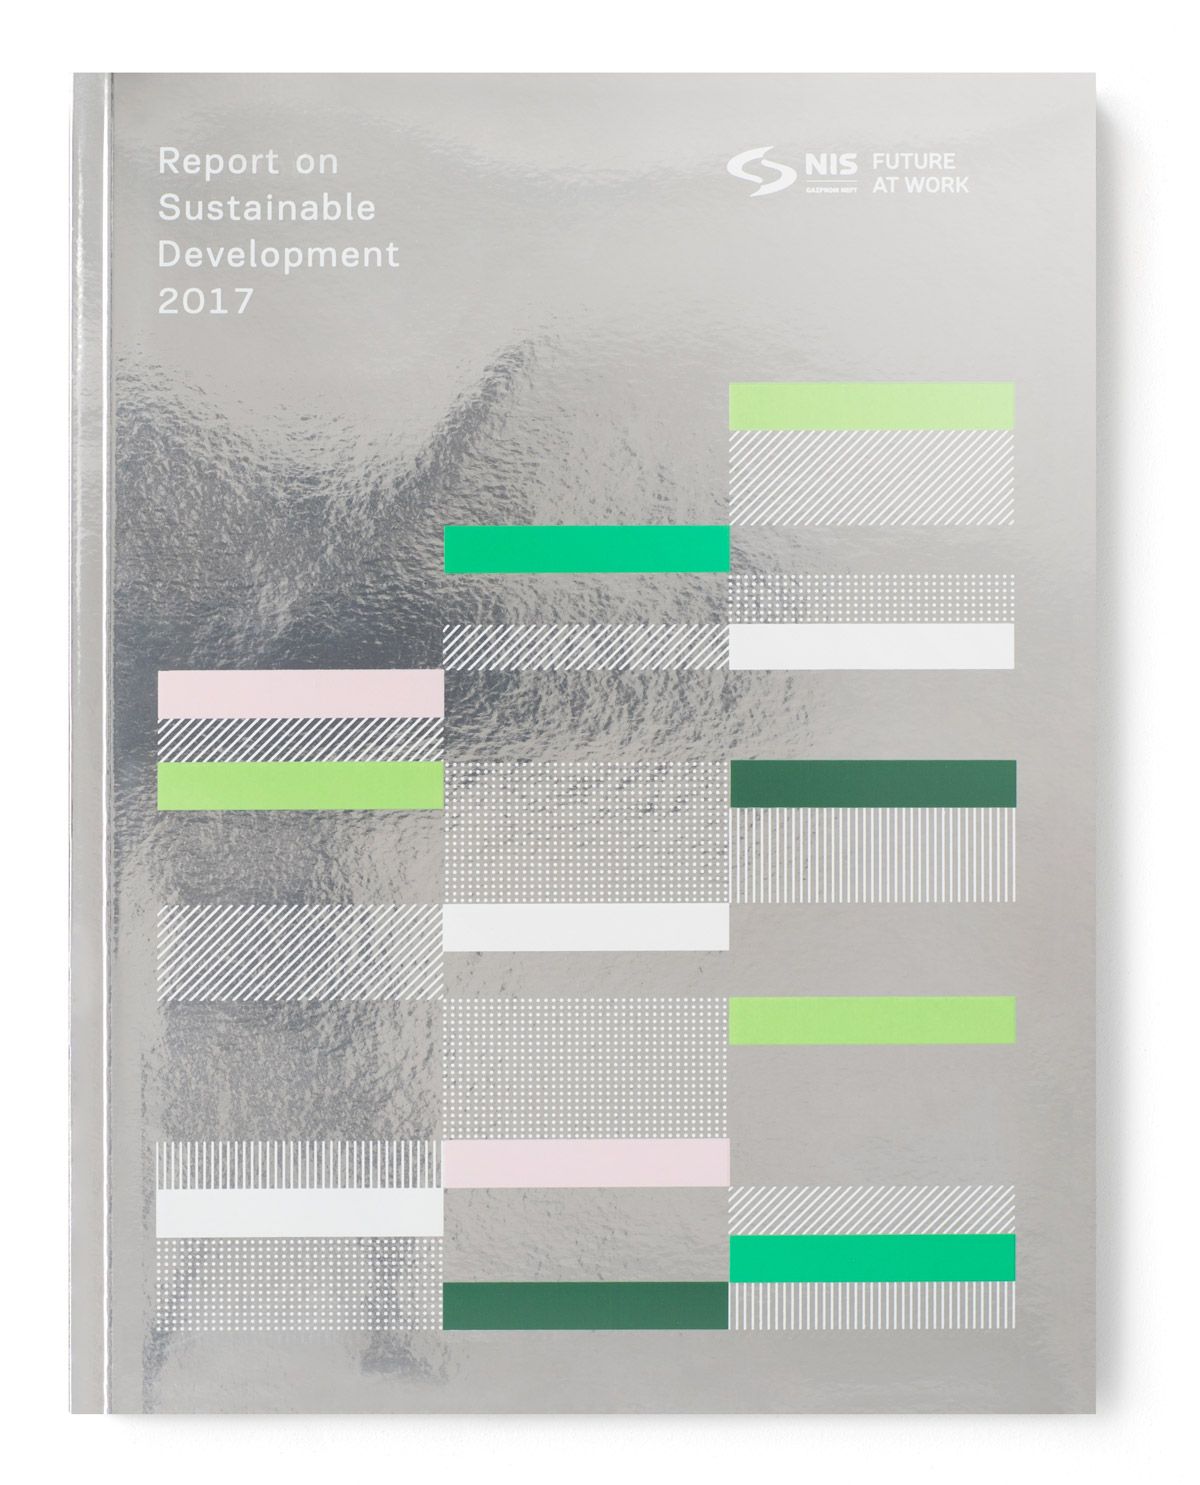
The design is clean, modern, and data-driven, utilizing a monochromatic gray background contrasted by vibrant, segmented color bars to represent quantitative information. The layout is highly structured, resembling a complex infographic or report summary.
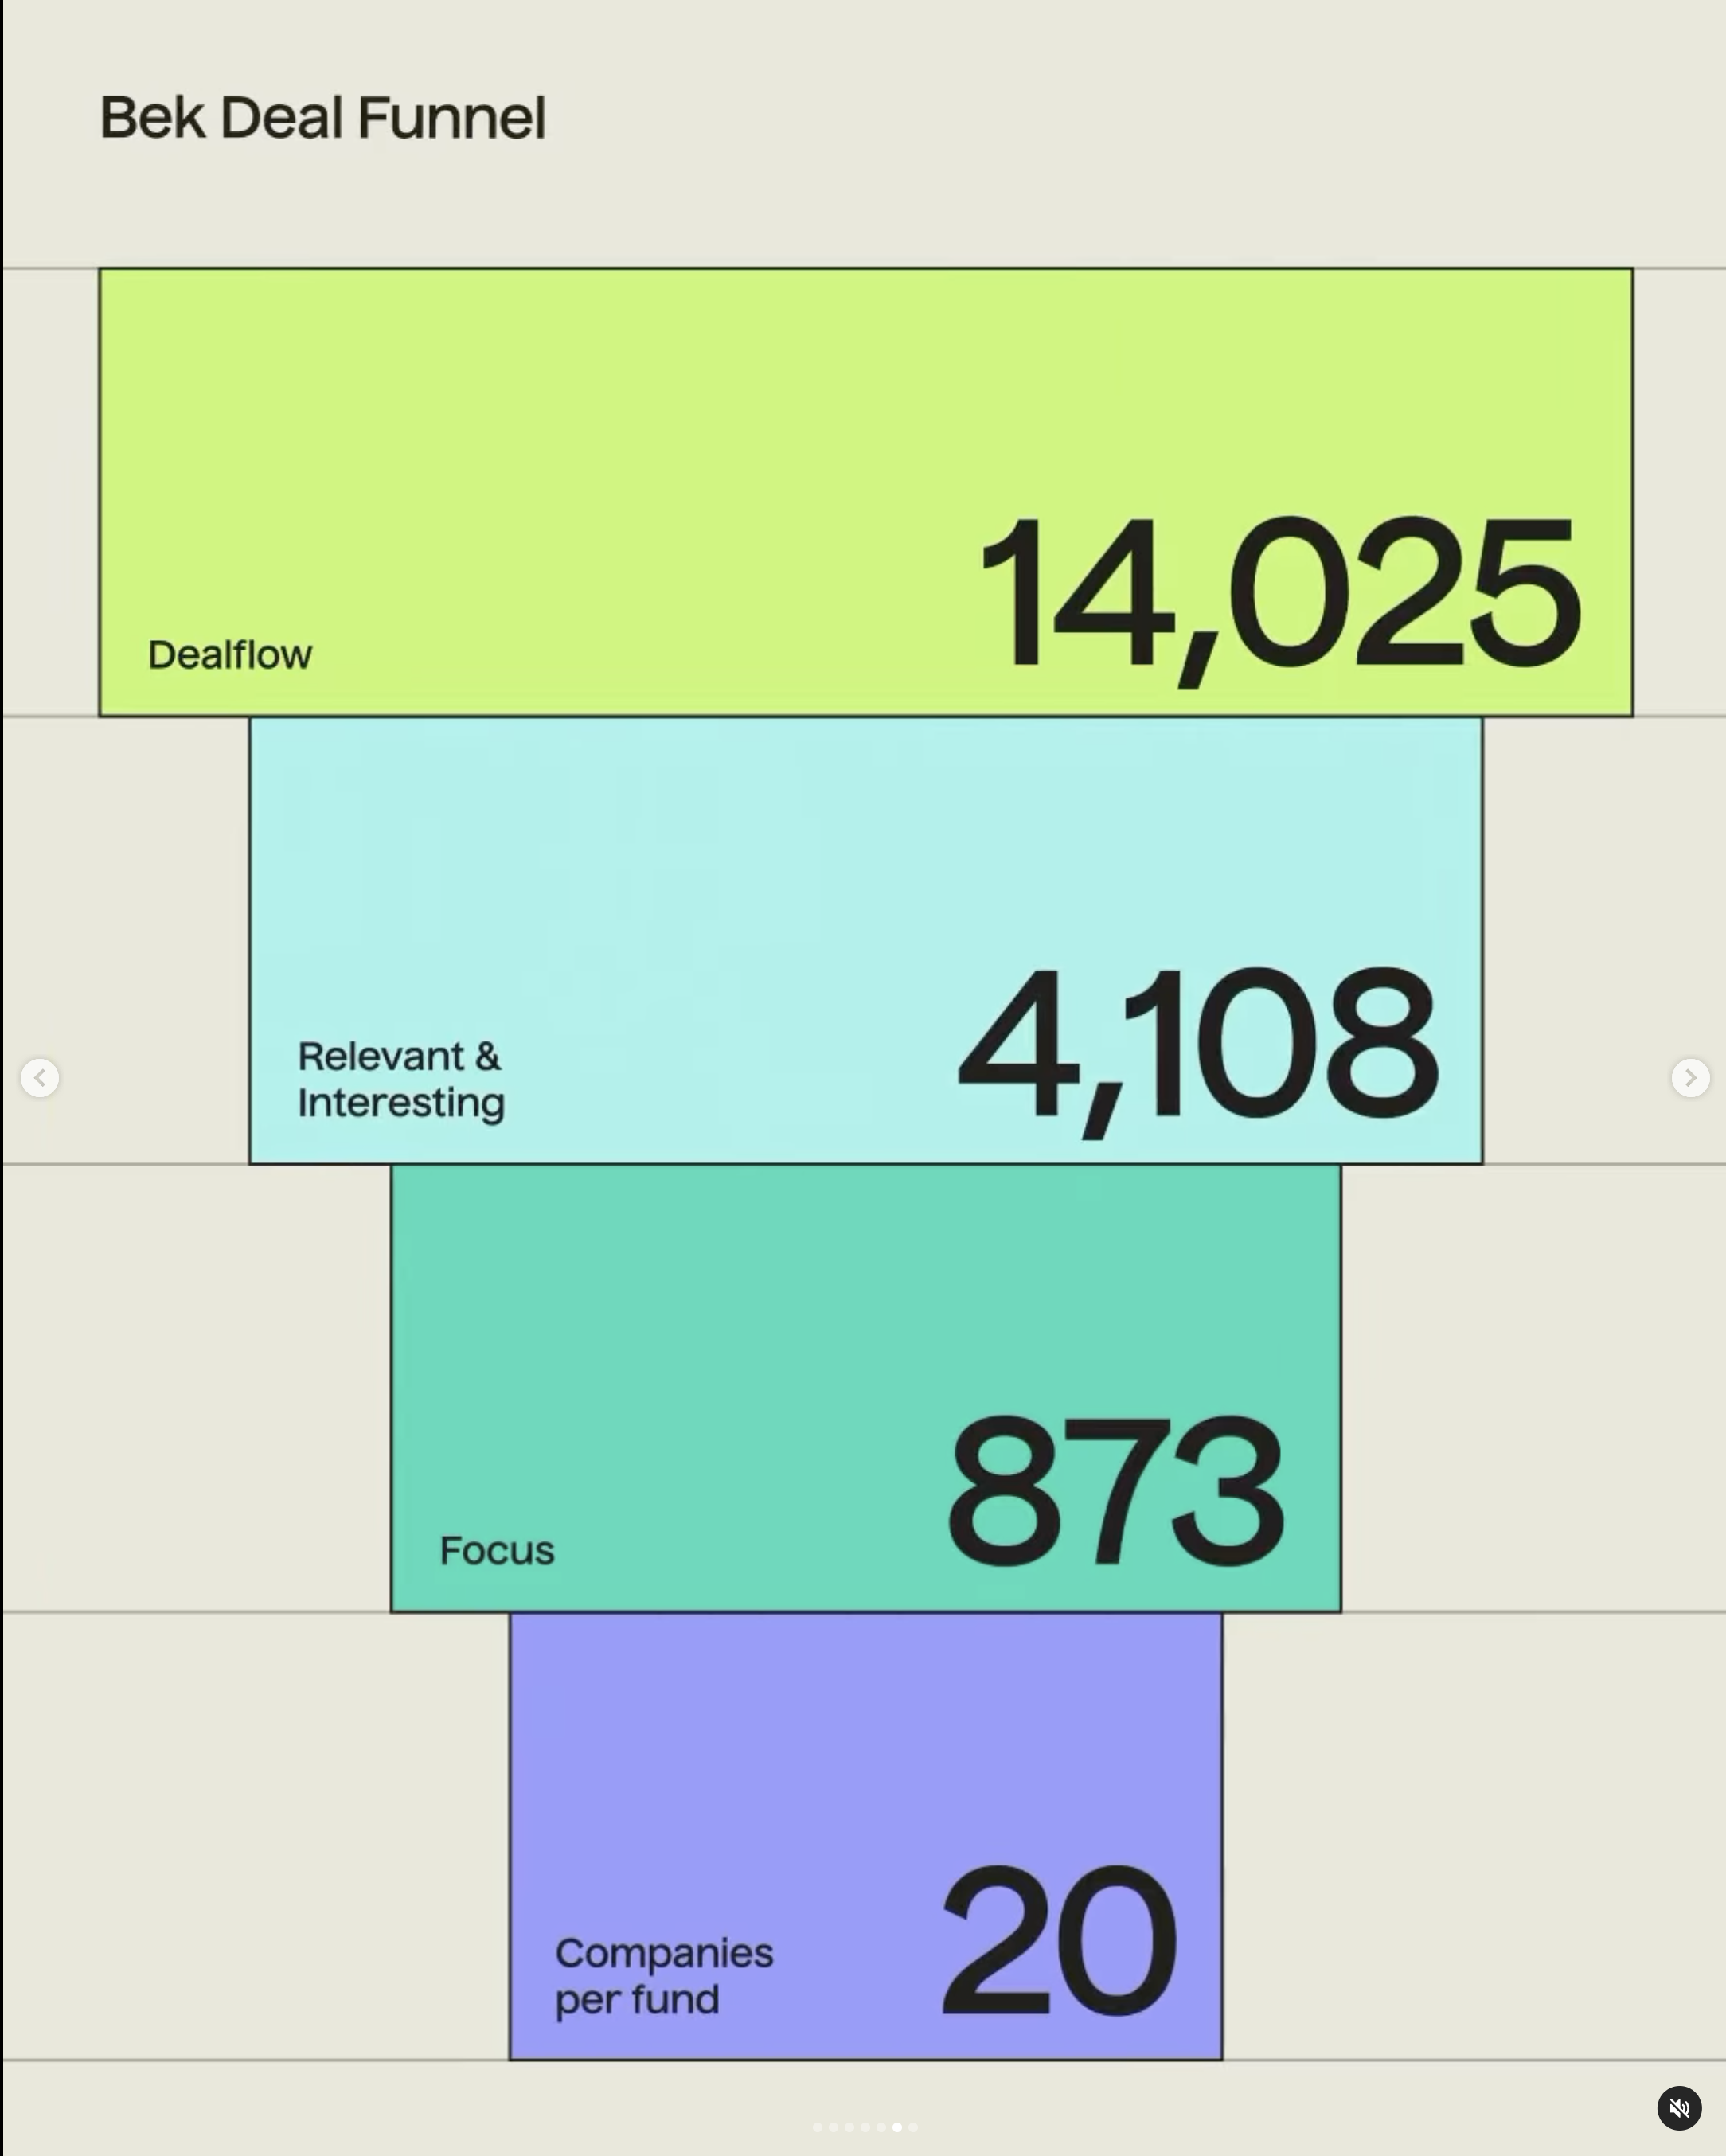
The image presents a clean, minimalist data visualization using stacked rectangular bars to represent hierarchical quantities. The design relies on flat color blocks and clear numerical labels, suggesting a focus on straightforward information delivery.
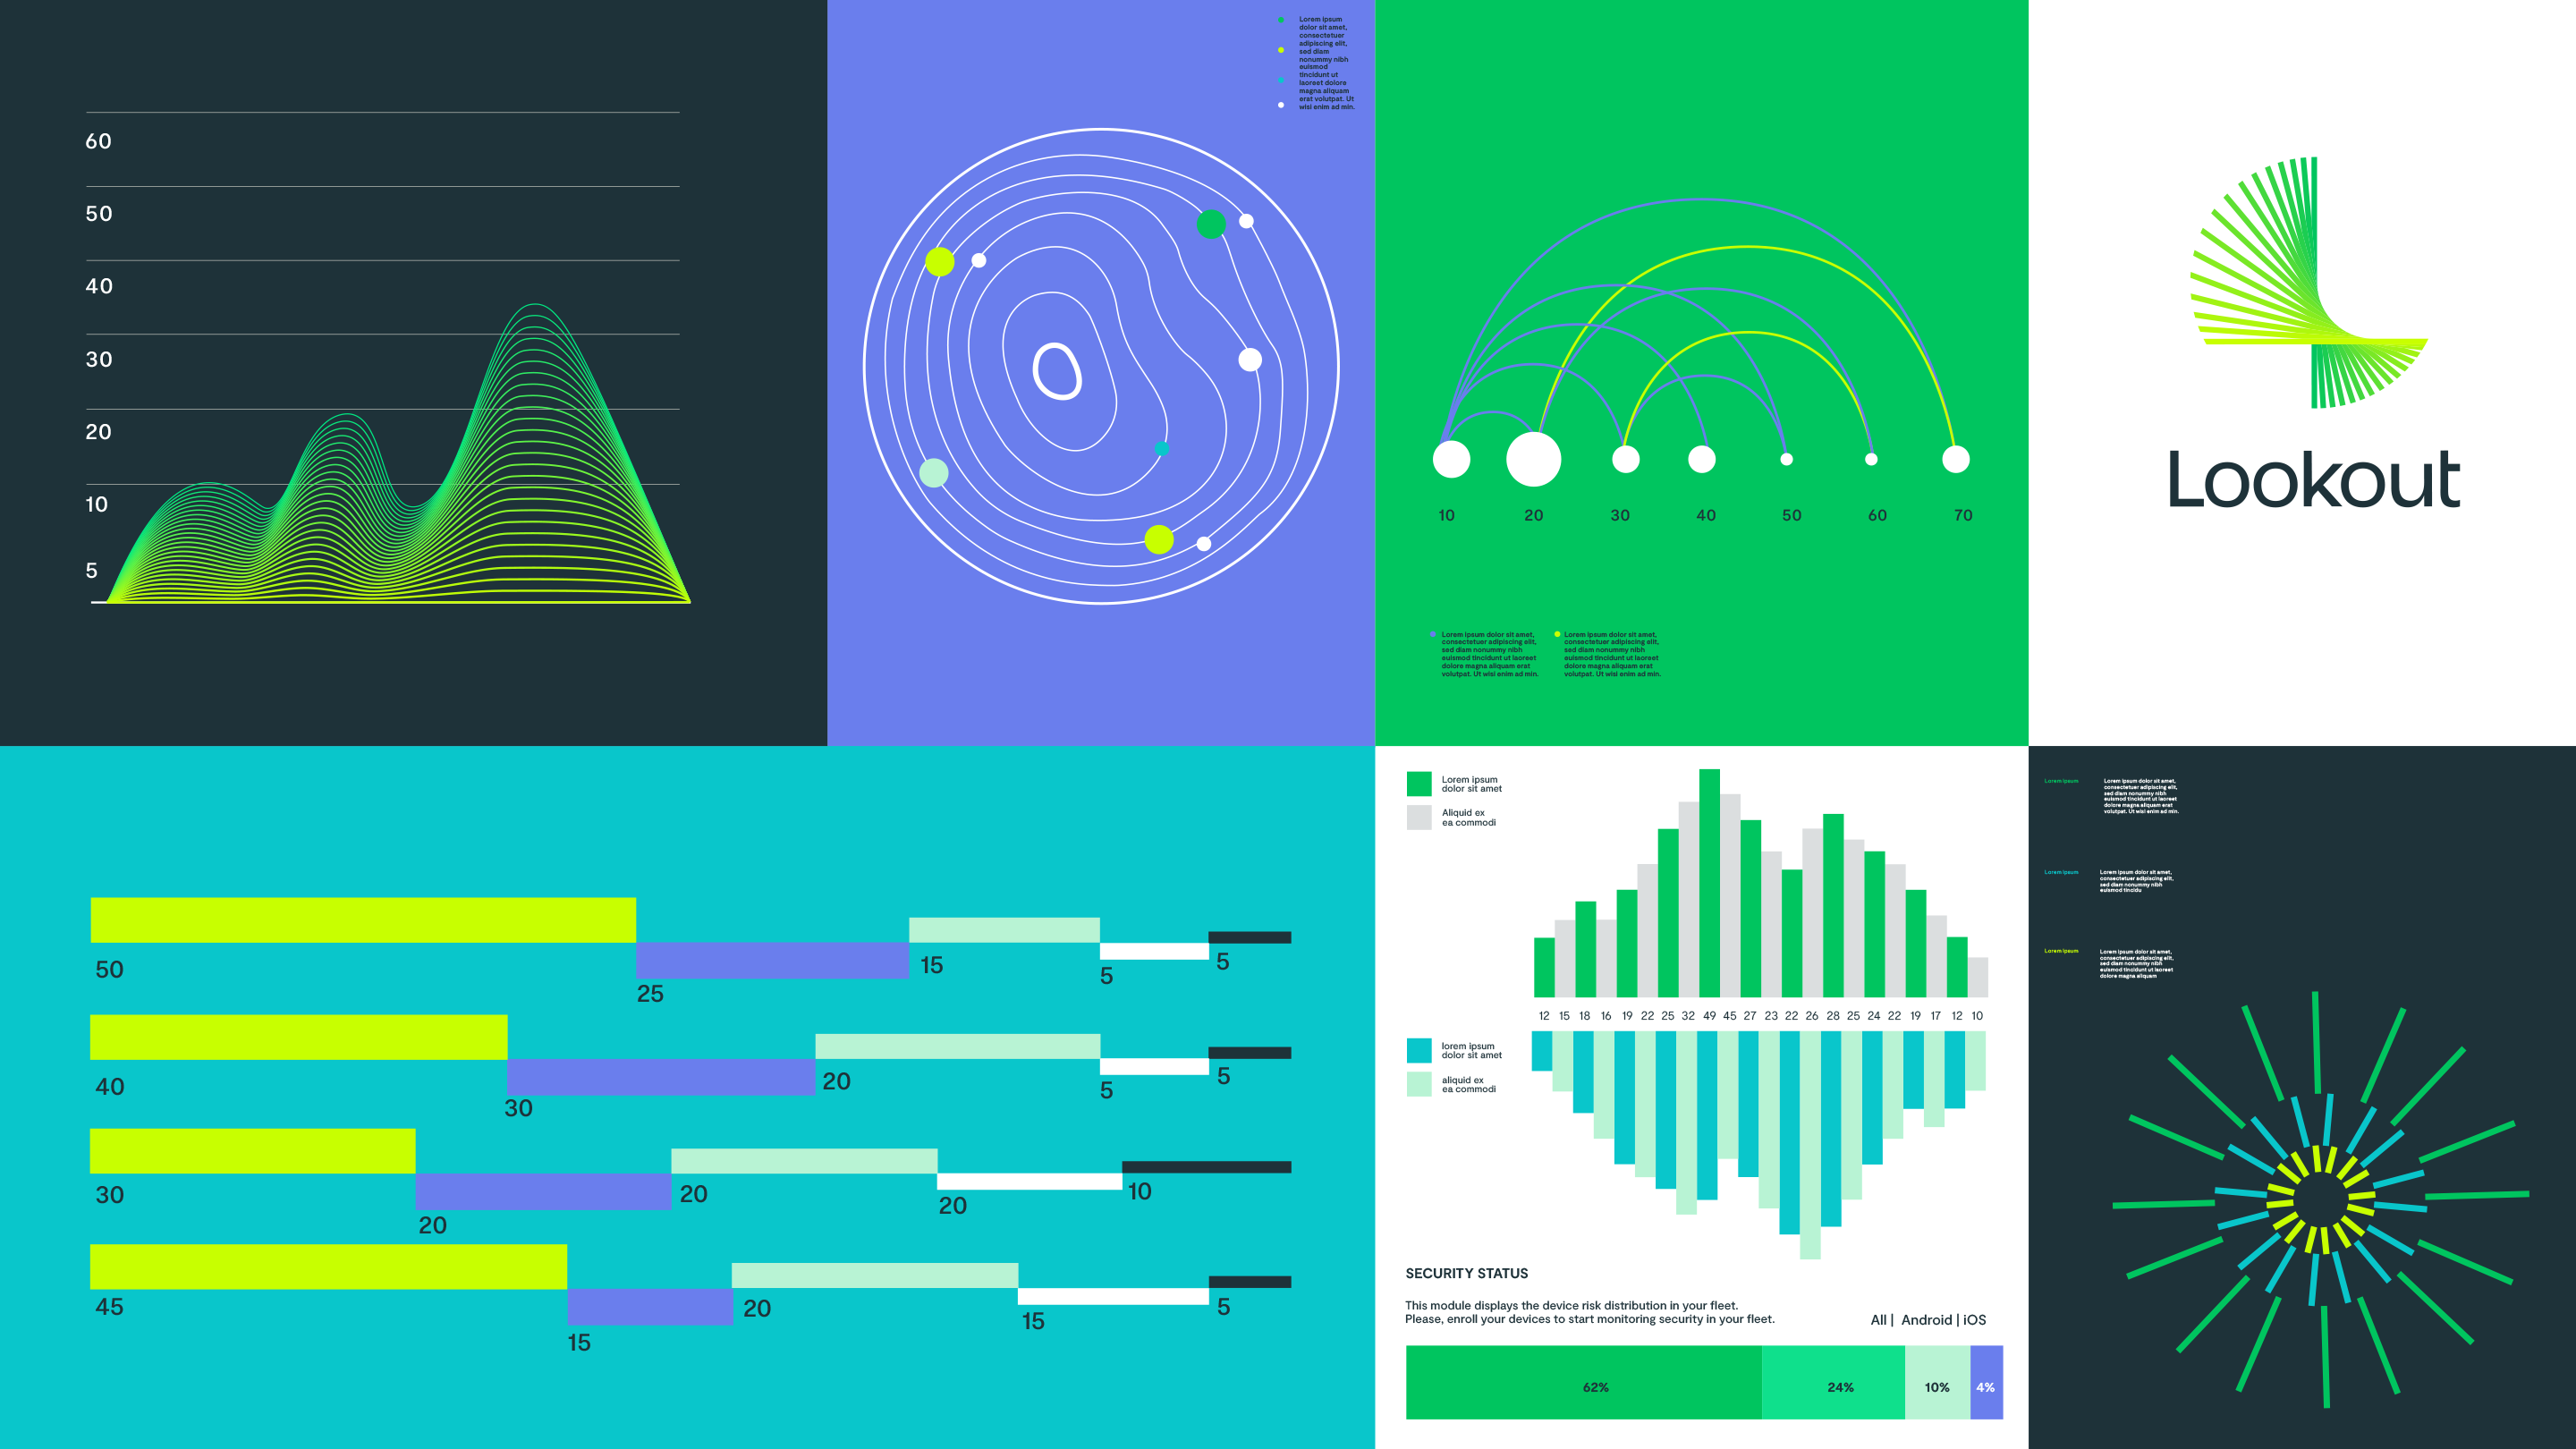
The image presents a modern, clean, and vibrant set of graphic elements, characterized by bold color blocking and abstract data visualizations. The design utilizes a bright, fresh palette to convey a sense of innovation and clarity.
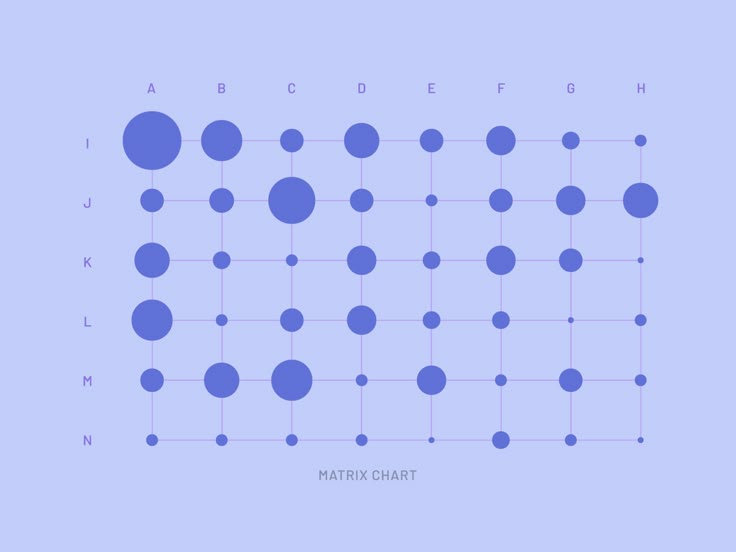
This image presents a minimalist, structured matrix chart design using a soft pastel color palette. The visual language is clean and systematic, relying on simple circles and connecting lines to convey data or relationships. The overall feel is organized, academic, and calm.
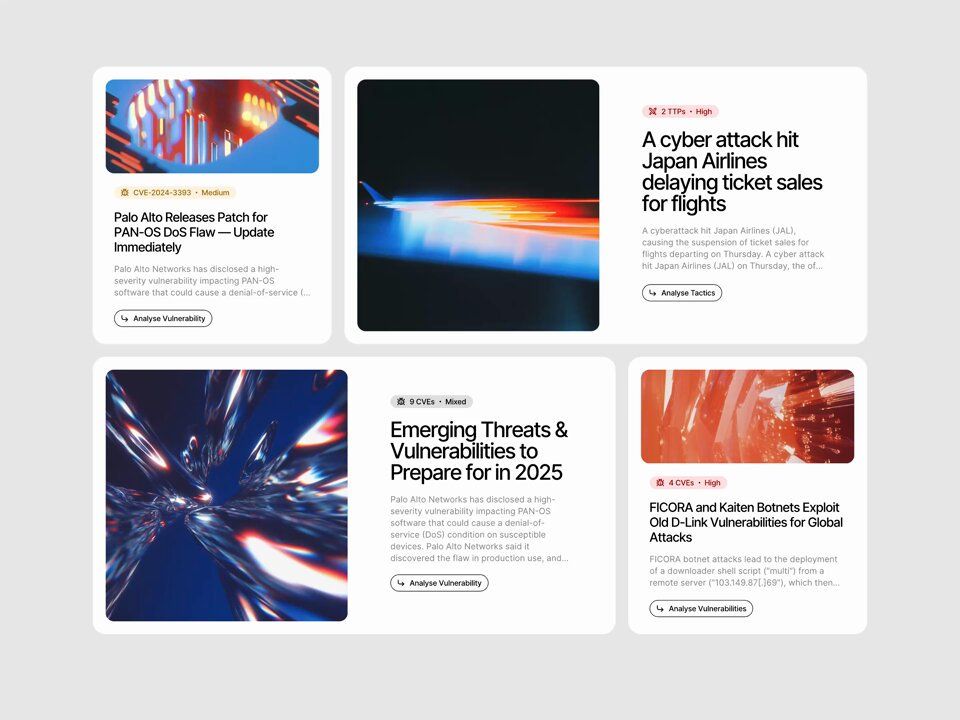
The image presents a clean, modern, and professional interface design, likely for a cybersecurity or technical report. It uses dark backgrounds contrasted with bright, dynamic light effects to convey high-tech and urgent information.
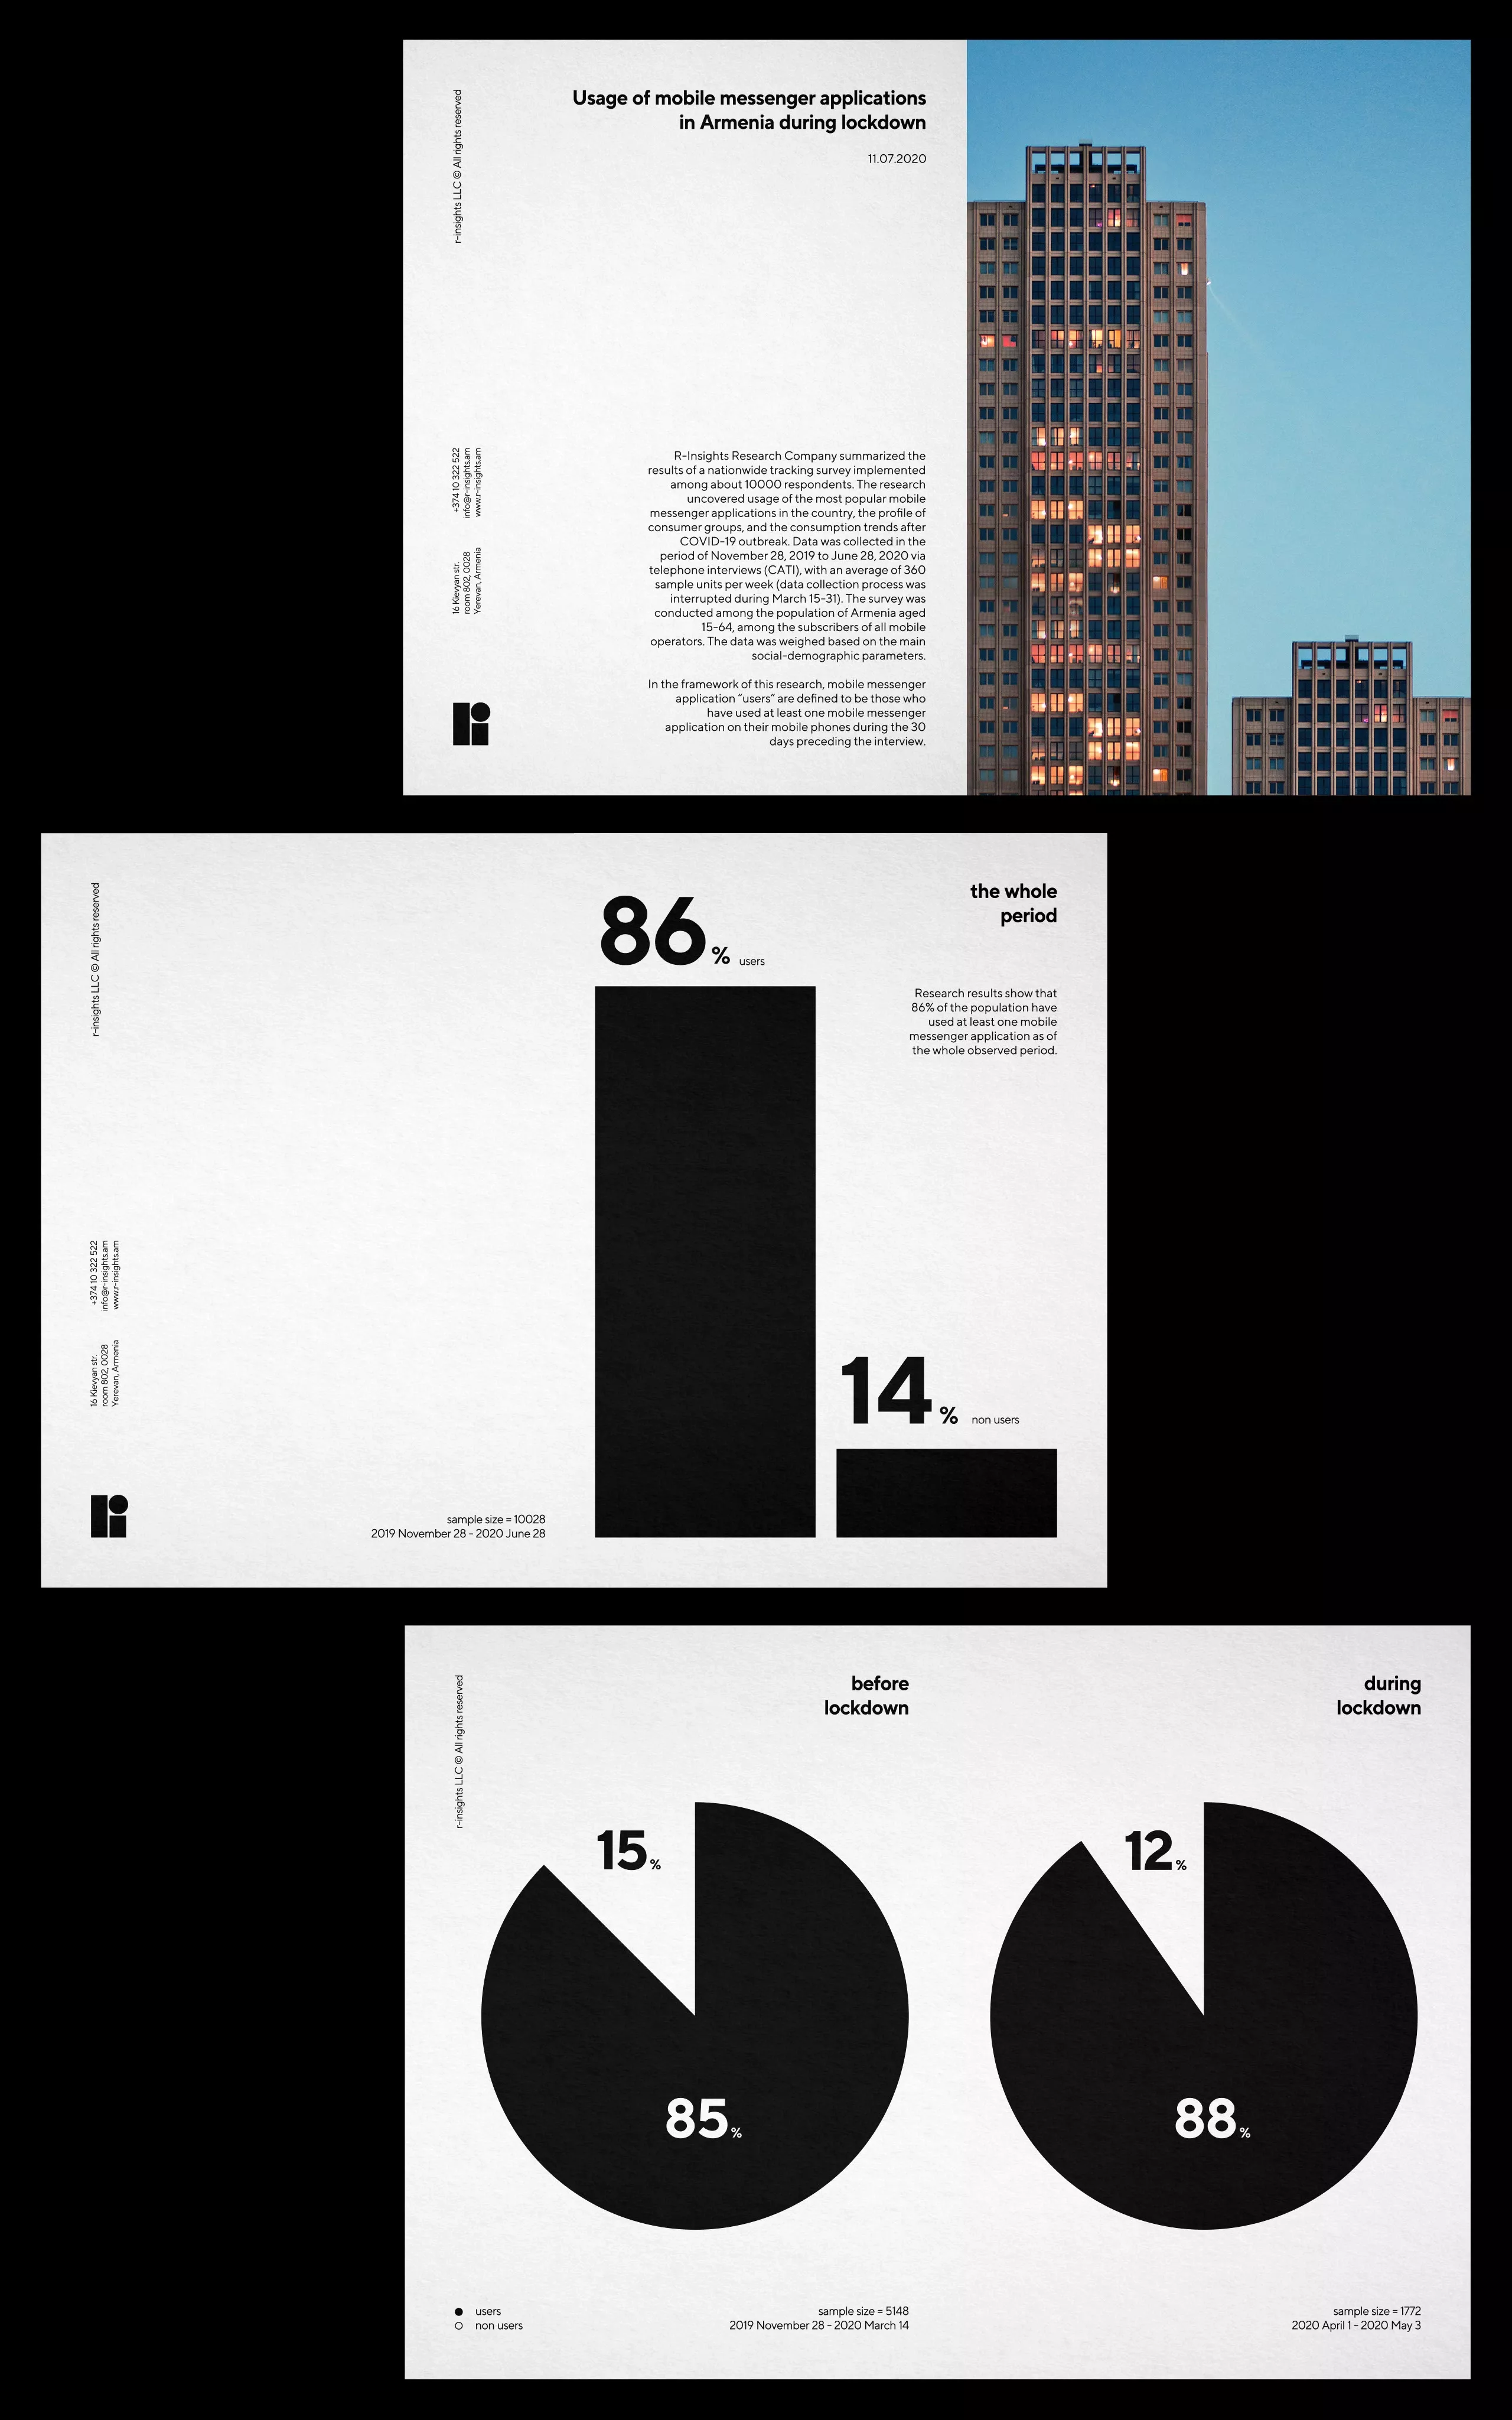
The image presents a clean, minimalist data visualization style using stark black and white elements. It employs strong geometric shapes like bars and pie charts to convey statistical information in a professional and objective manner.
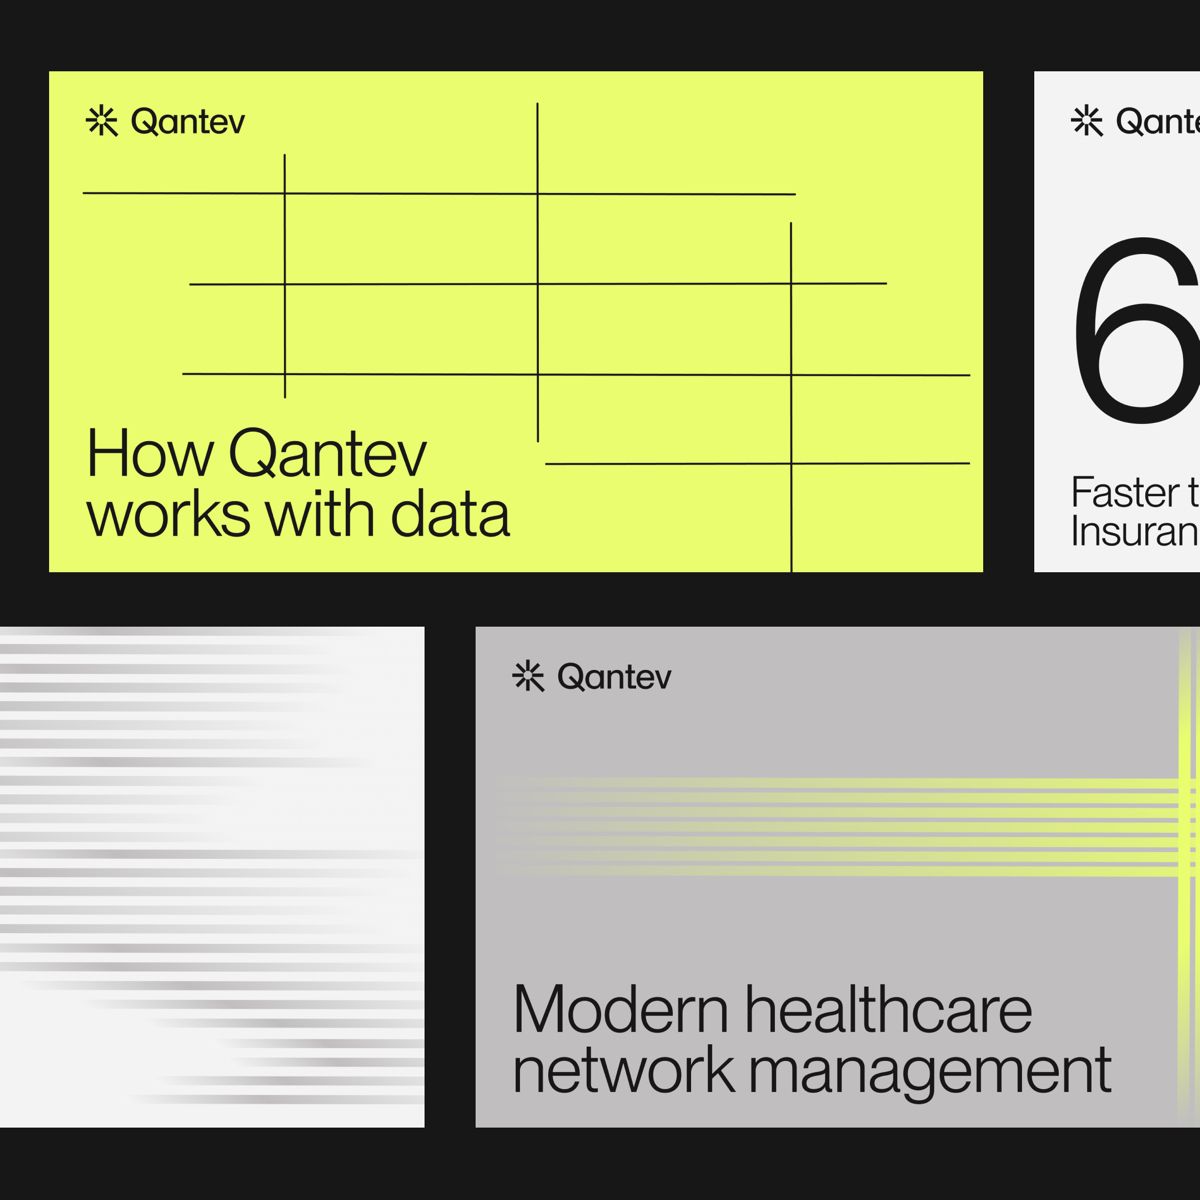
The image presents a clean, minimalist presentation style using a limited palette of yellow and gray. It utilizes a grid structure to organize information, suggesting a technical or corporate focus on data processing and healthcare management.