dashboard design
8 designs
Showing 8 of 8 (8 total)
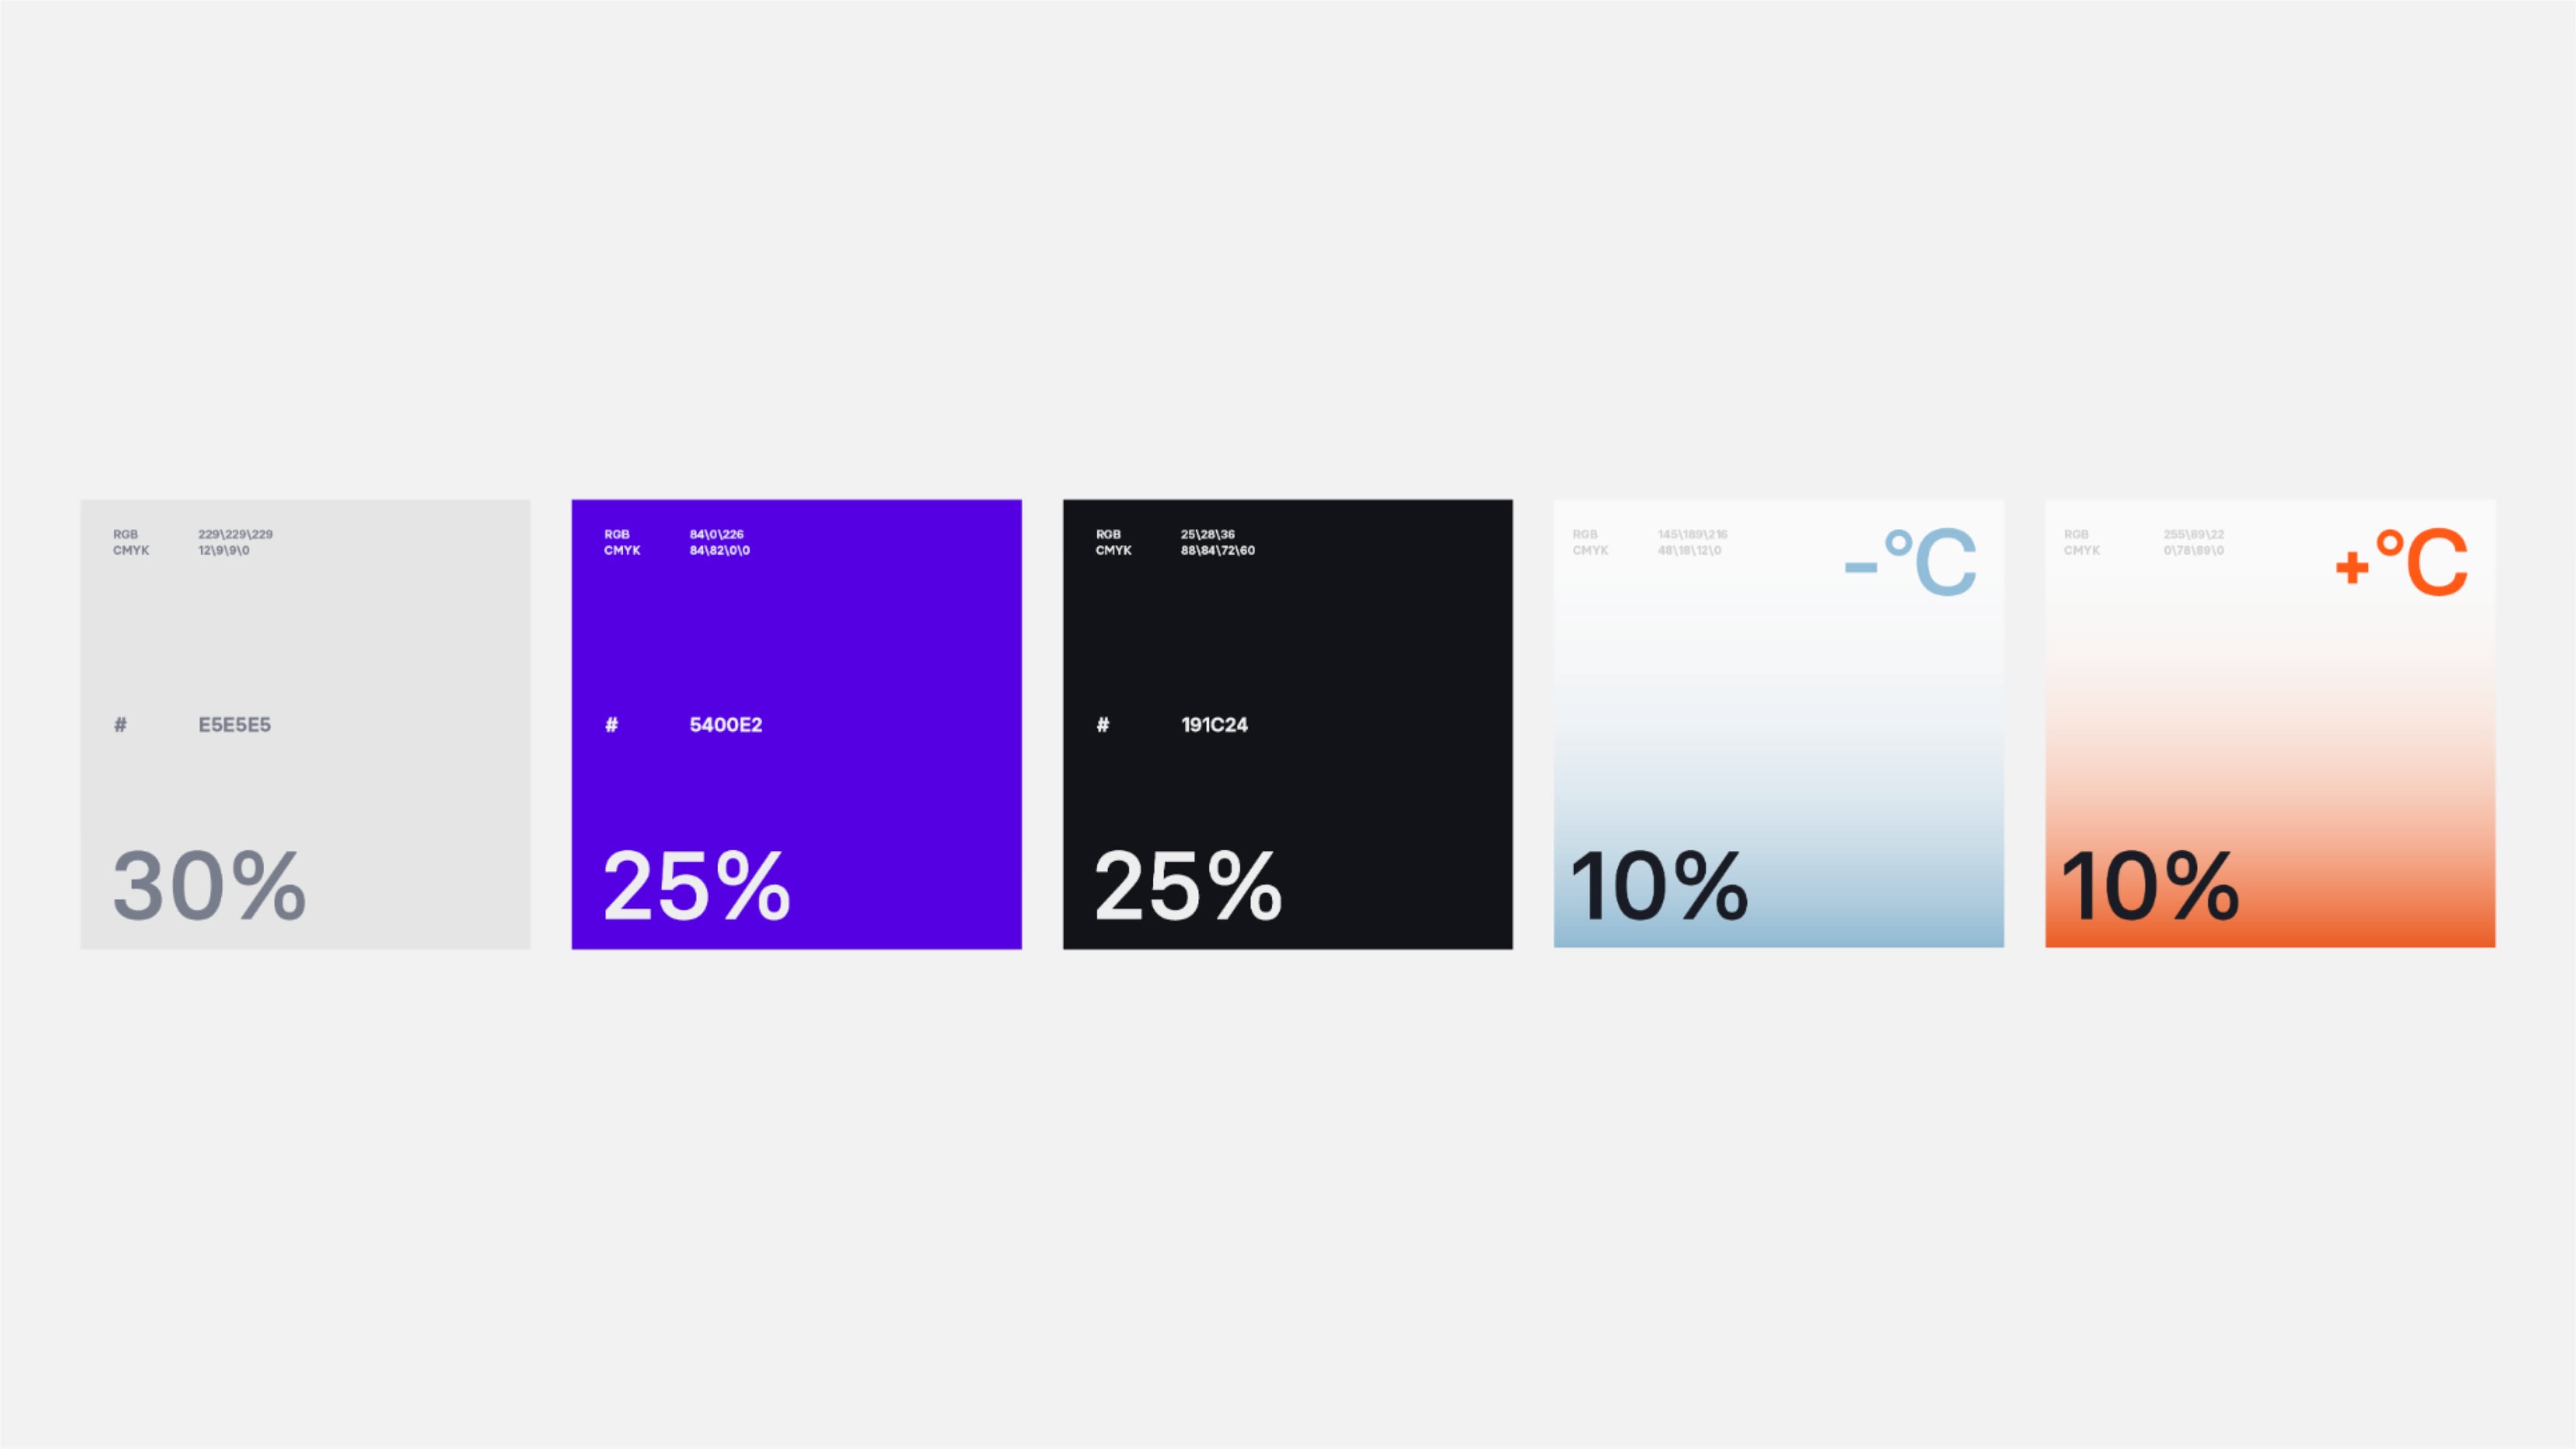
This image presents a clean, modern data visualization using five distinct panels arranged horizontally. The design relies heavily on color blocking—ranging from cool purples and blacks to warm oranges—to differentiate metrics effectively. The overall visual language is minimalist, precise, and highly structured for quick information consumption.
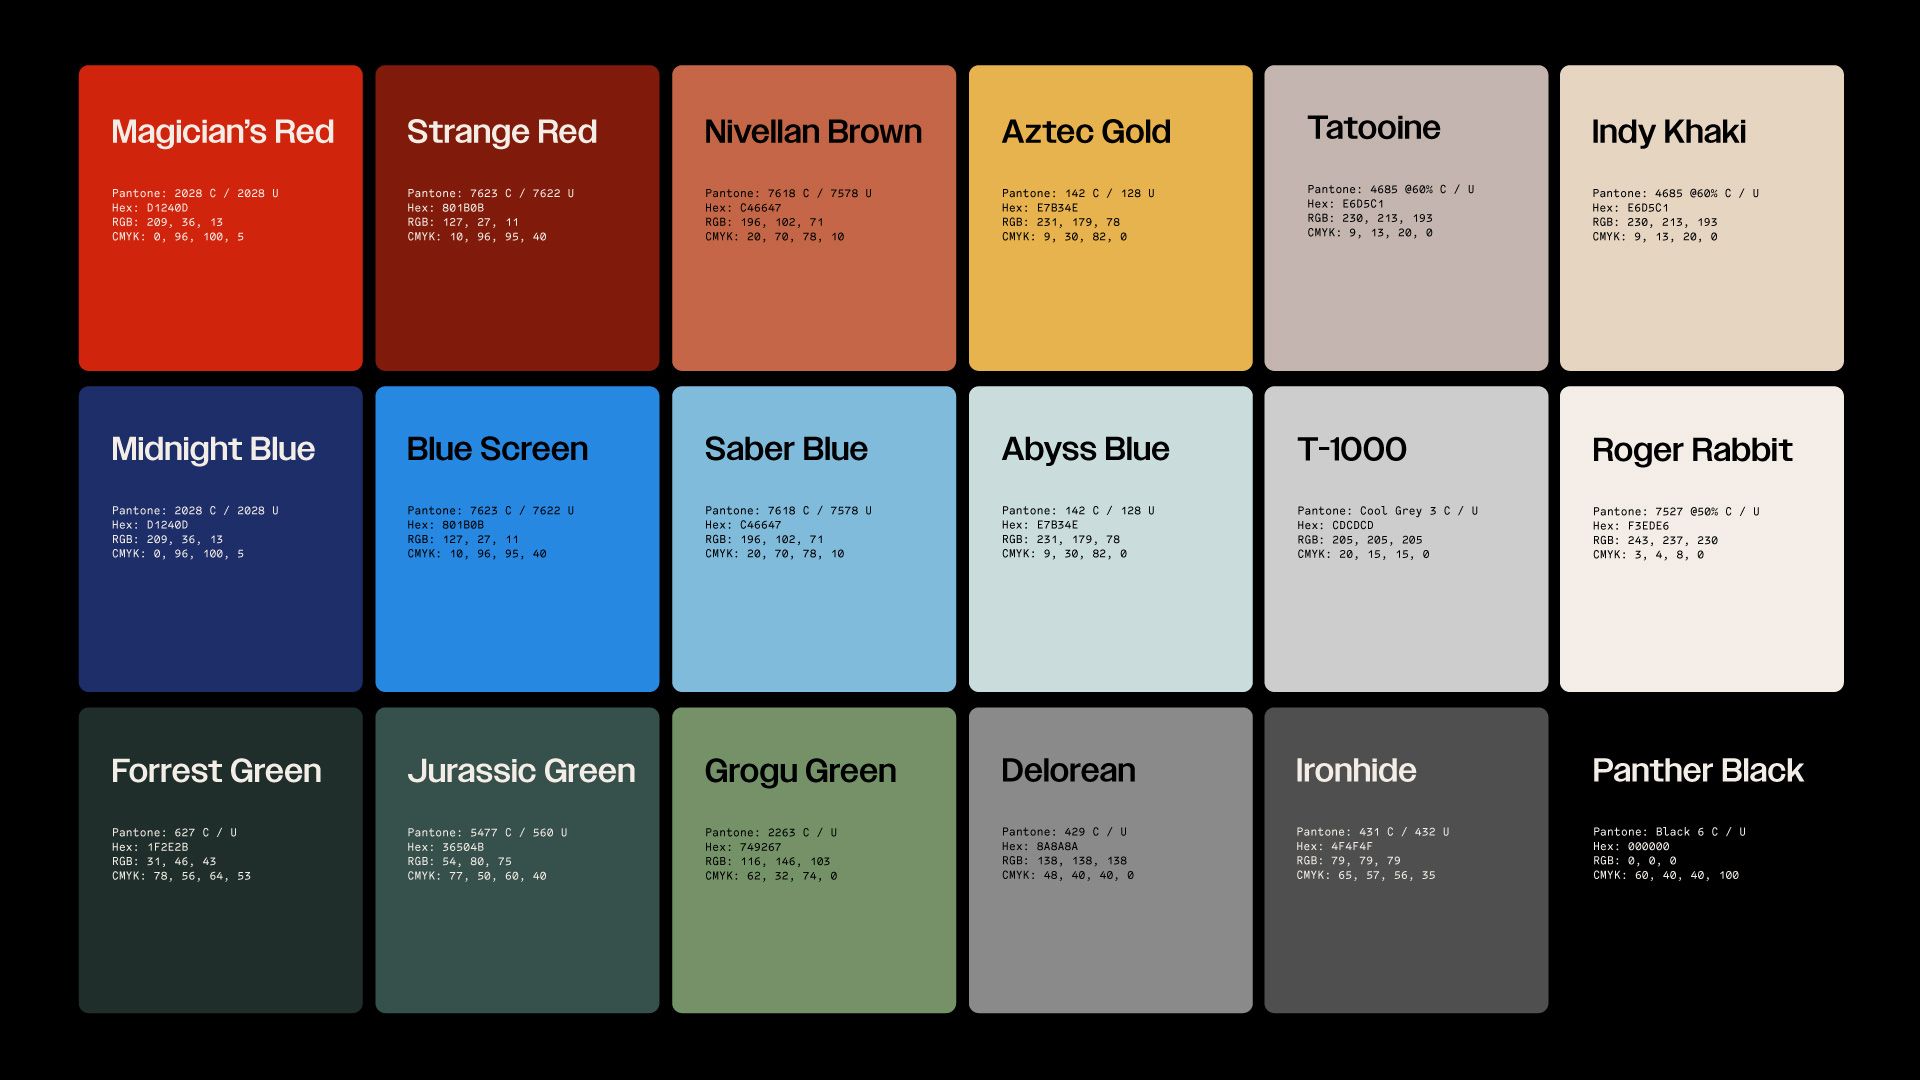
This image presents a highly organized grid of distinct color tiles, showcasing a strong emphasis on rich, saturated hues and clear segmentation. The visual language is clean and modern, relying on solid blocks of color to define individual options or brands. The overall feel is professional, organized, and visually striking due to the careful selection of complementary tones.
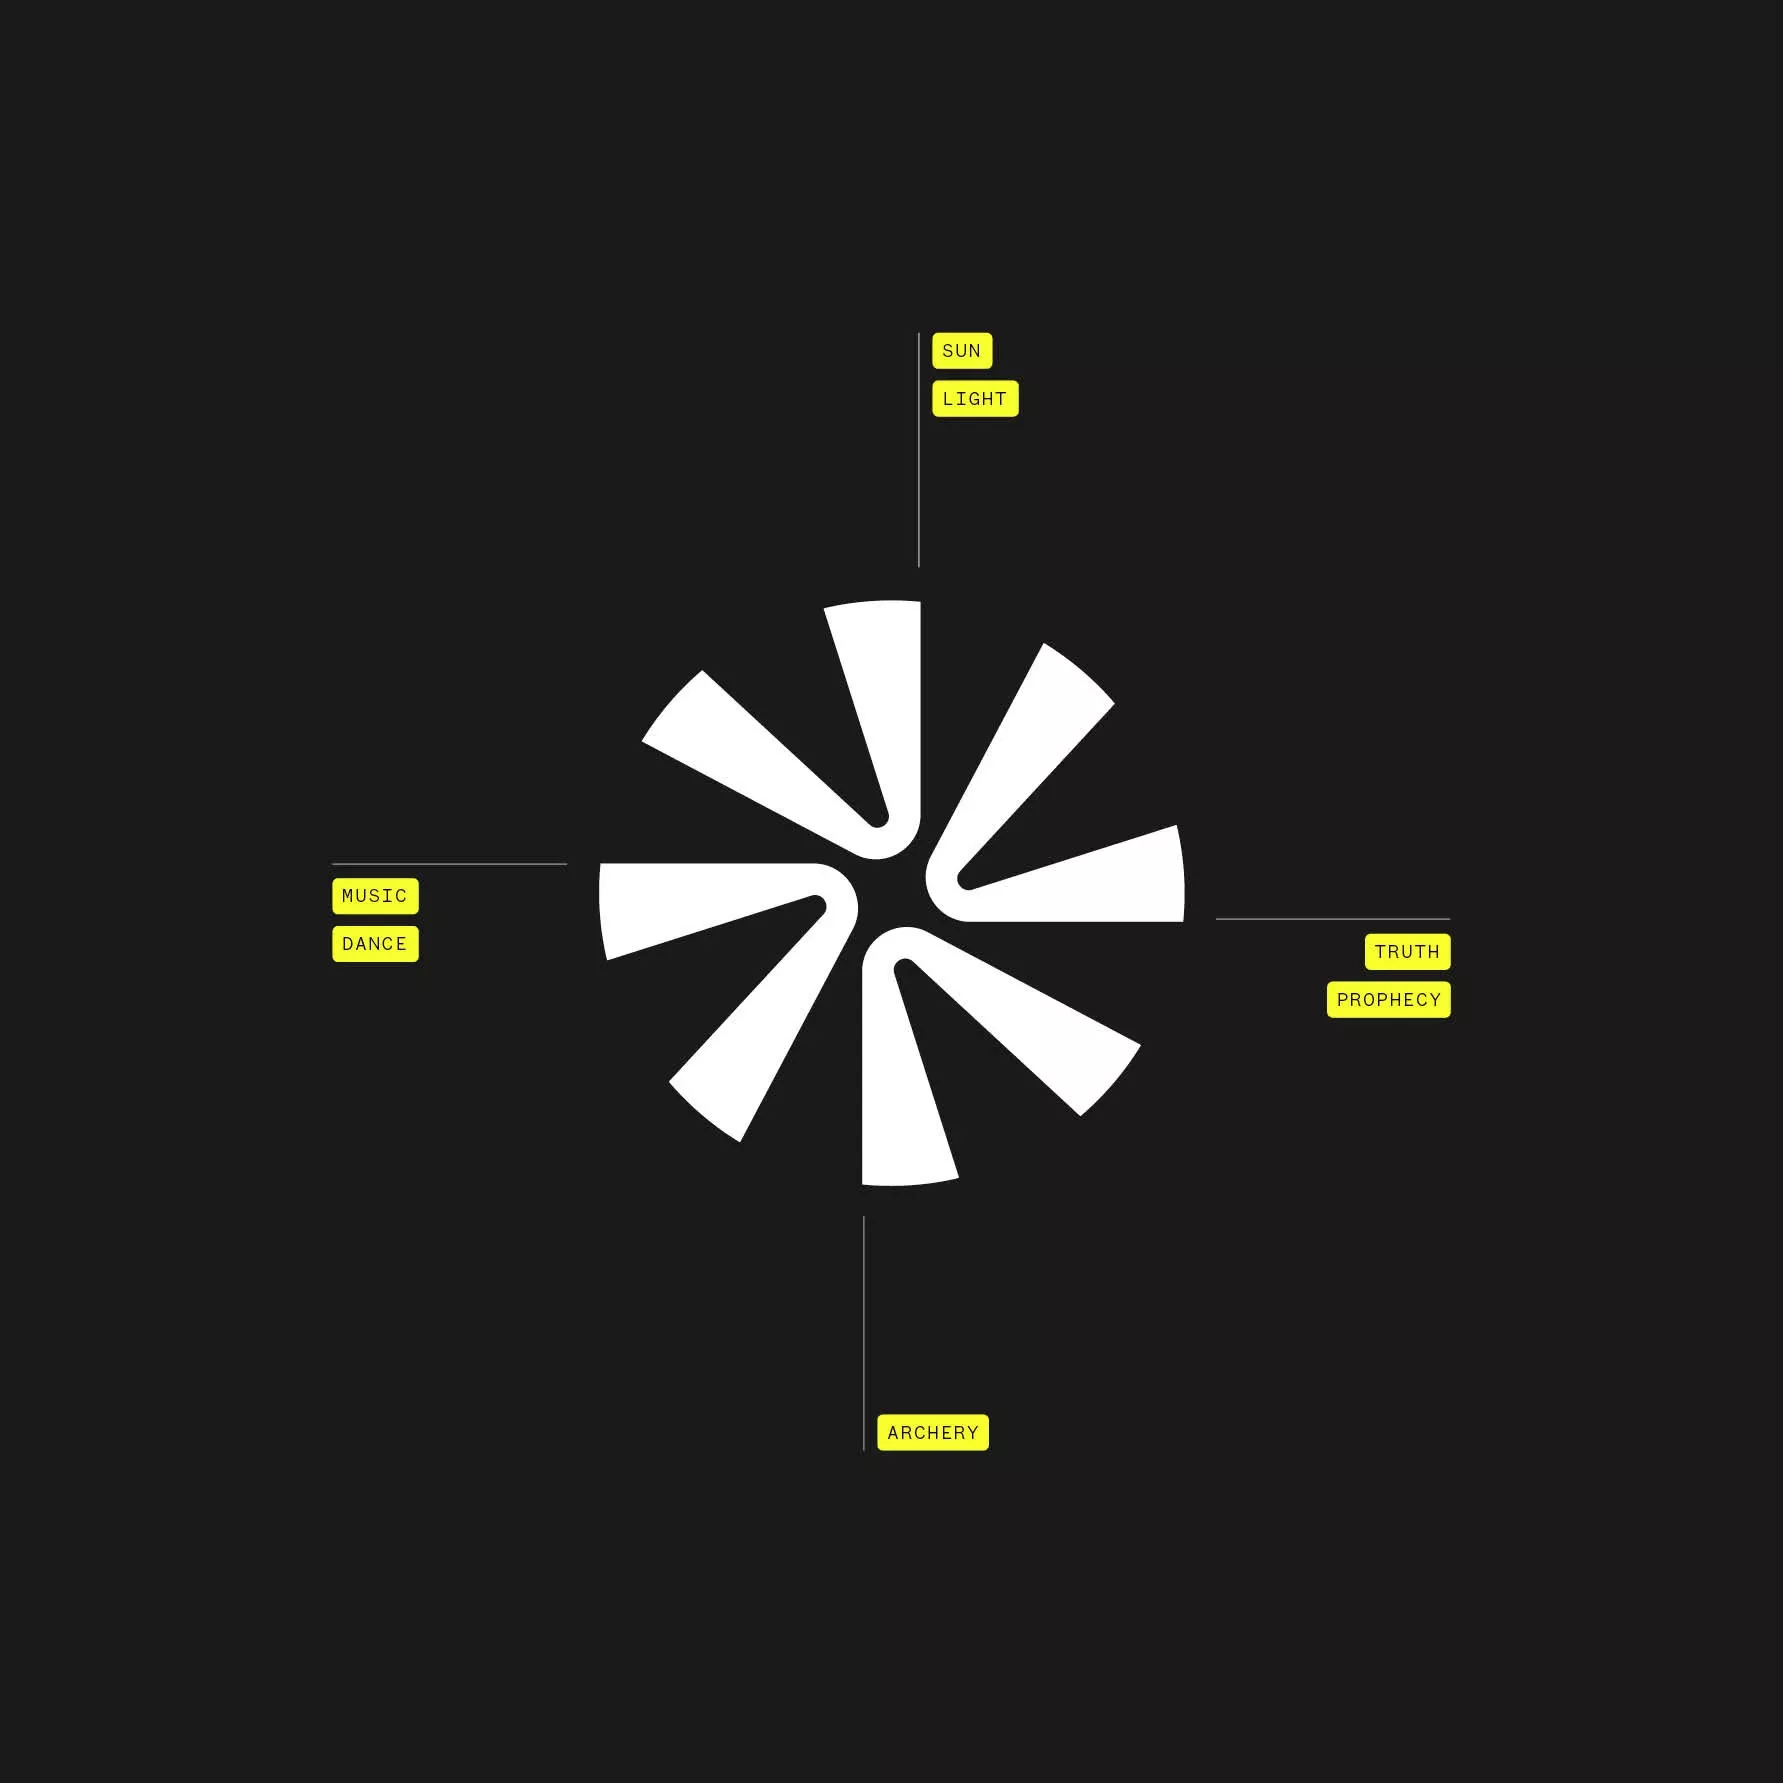
A minimalist infographic featuring a radial pie chart with white segments arranged in a circular pinwheel pattern against a dark background. Yellow label tags are positioned around the cardinal directions, connected by thin lines to the central diagram, creating a clean, organized data visualization layout.
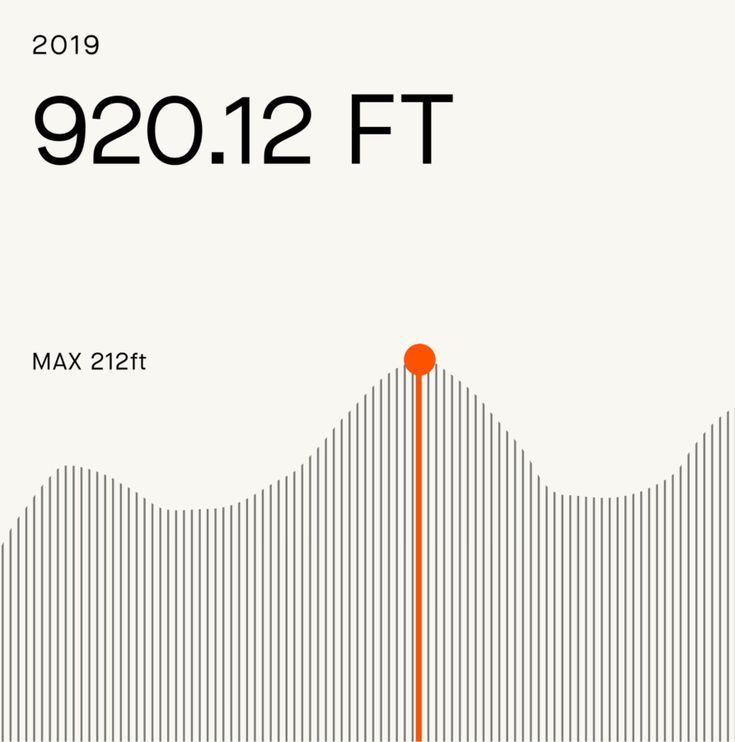
A minimalist data visualization dashboard displaying elevation or altitude metrics for 2019, featuring a clean beige background with a prominent wavy line graph rendered in thin black strokes. The design emphasizes clarity and precision through restrained typography and a single accent color highlighting the peak value.
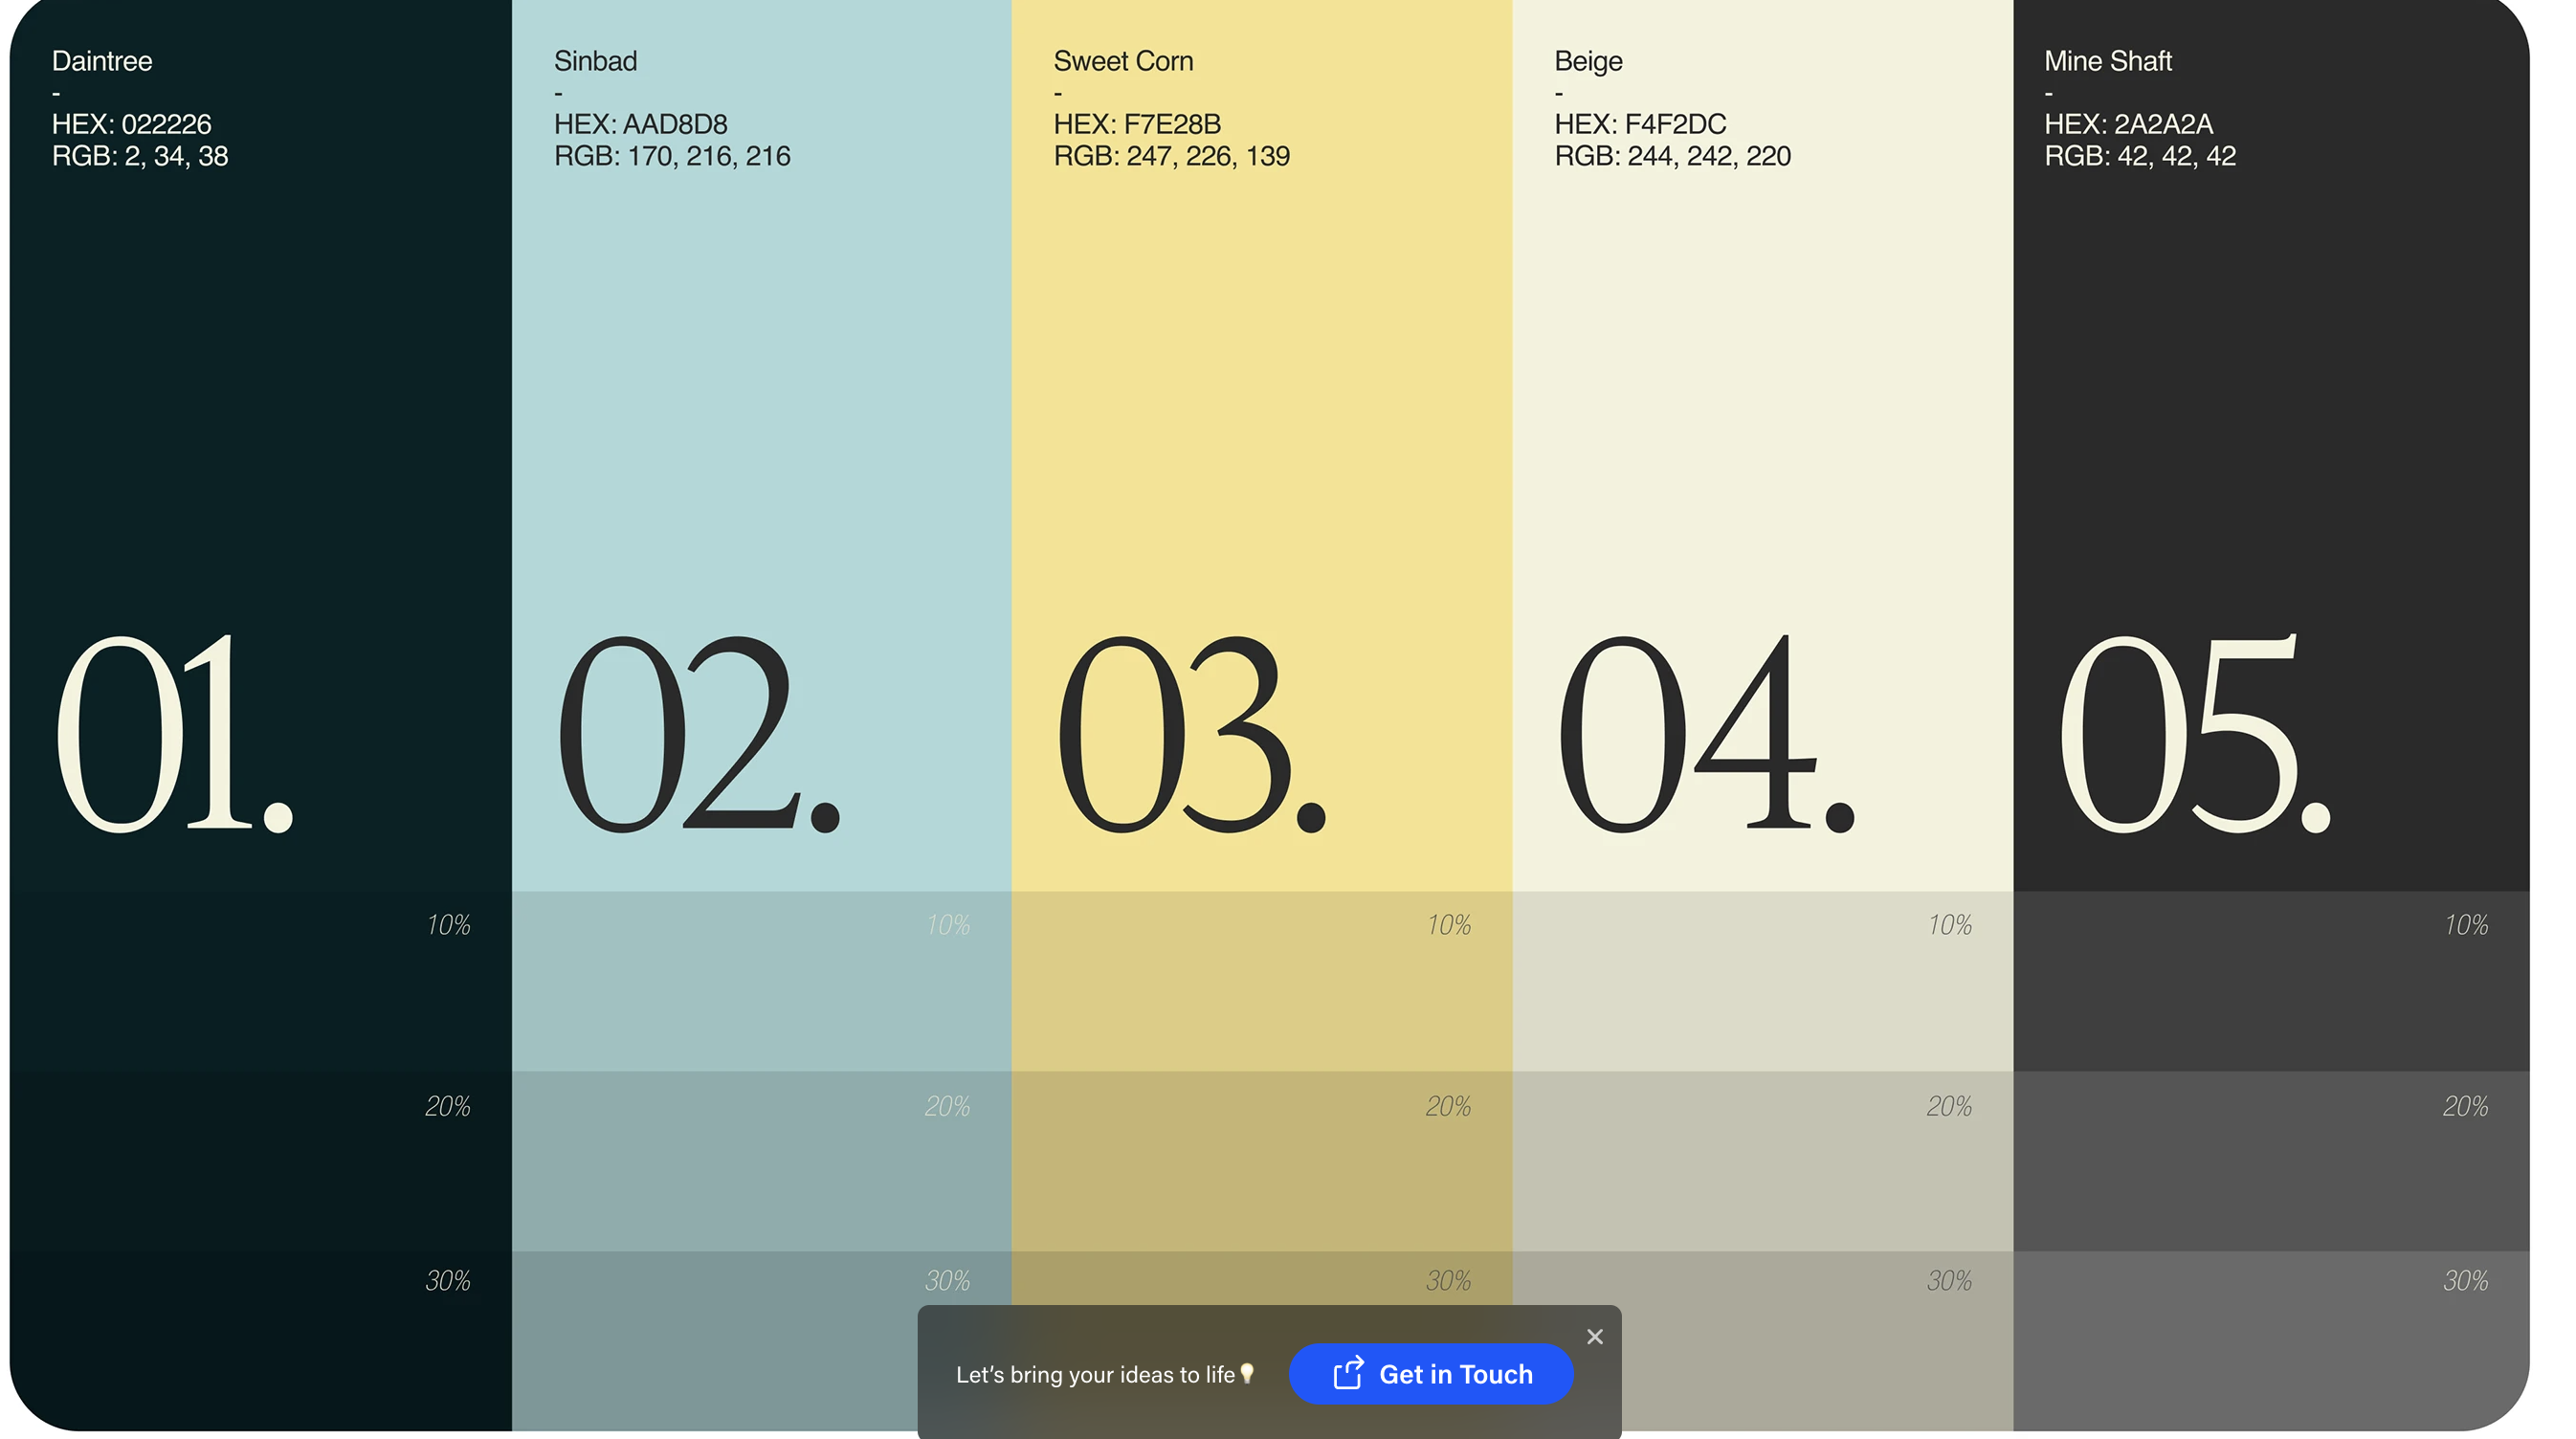
This design utilizes a clean, segmented grid structure to present five distinct data points. The visual language is minimalist and professional, relying on muted, sophisticated colors to clearly differentiate sections while maintaining a cohesive aesthetic.
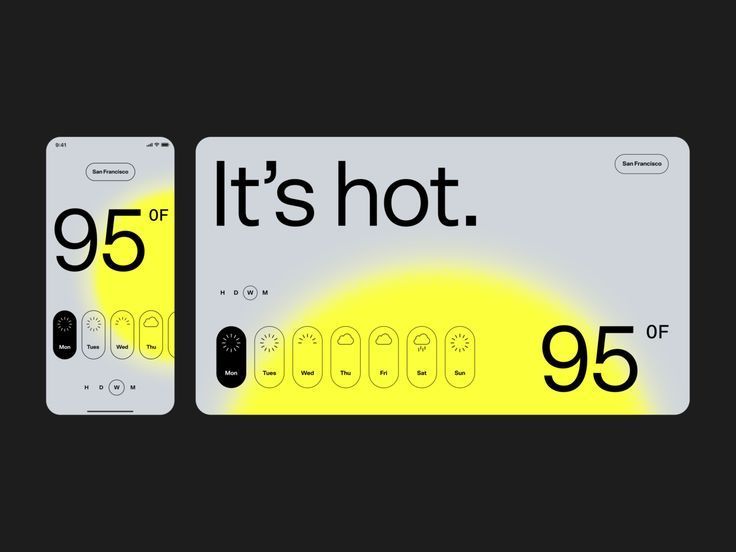
This design features a clean, modern user interface focusing on data visualization, primarily using color gradients to represent temperature. The visual language is direct and functional, successfully communicating intense heat through a vibrant yellow glow against a dark background. The overall feel is crisp, contemporary, and highly informative.
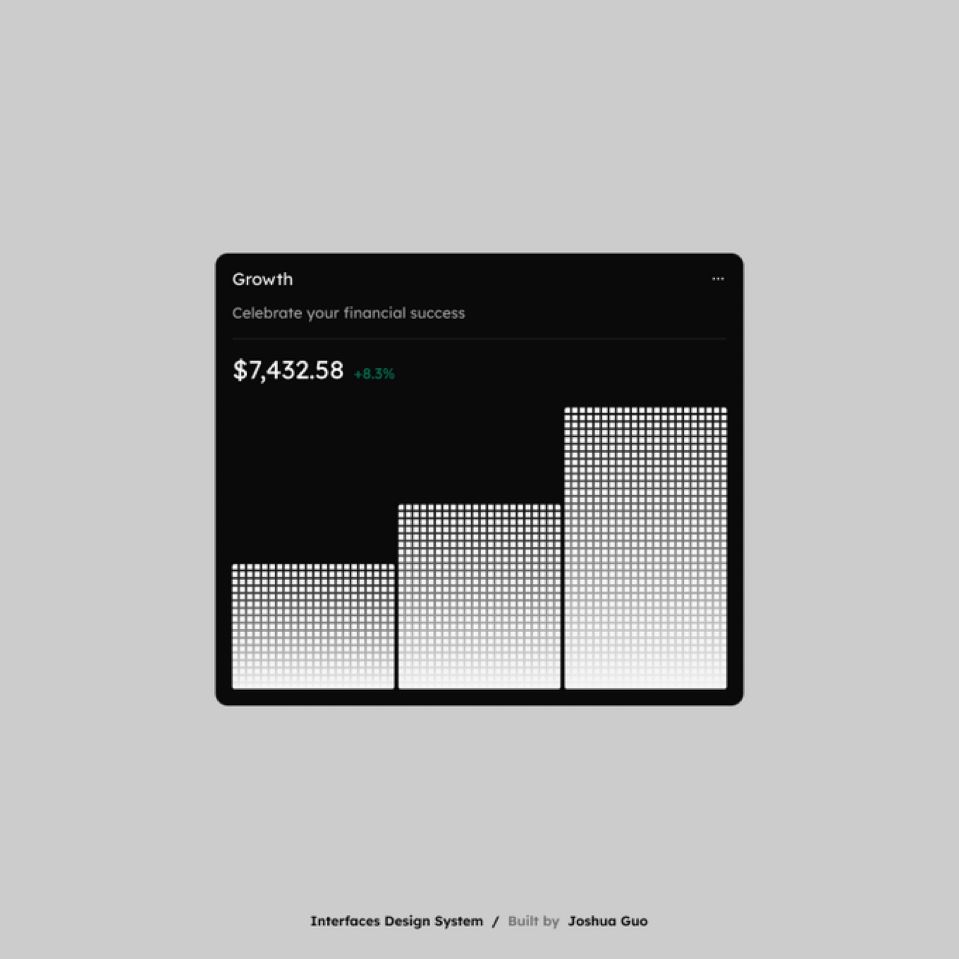
This interface presents a clean, minimalist data visualization centered around financial growth metrics. The design effectively uses negative space and high contrast to ensure the key data points are immediately readable and professional.
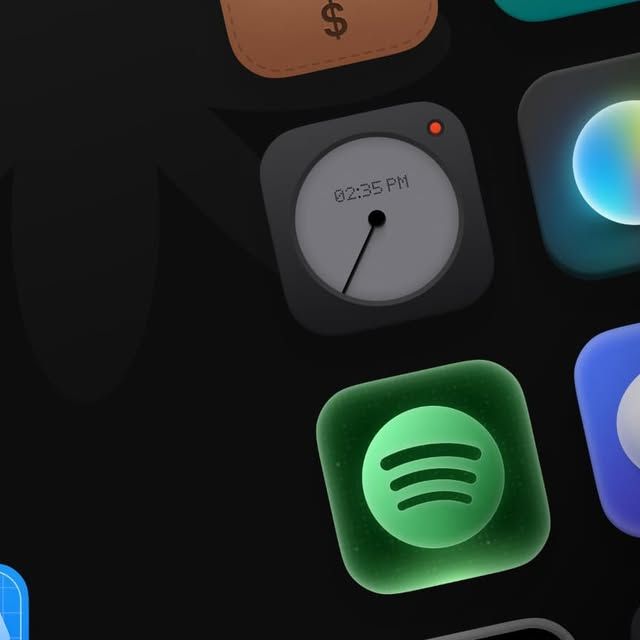
This image showcases a modern, dark-mode interface filled with distinct, softly glowing UI elements and icons. The visual language emphasizes clean lines, subtle gradients, and high contrast to create a sophisticated and functional aesthetic. The overall feel is slick, professional, and deeply immersive.